
|
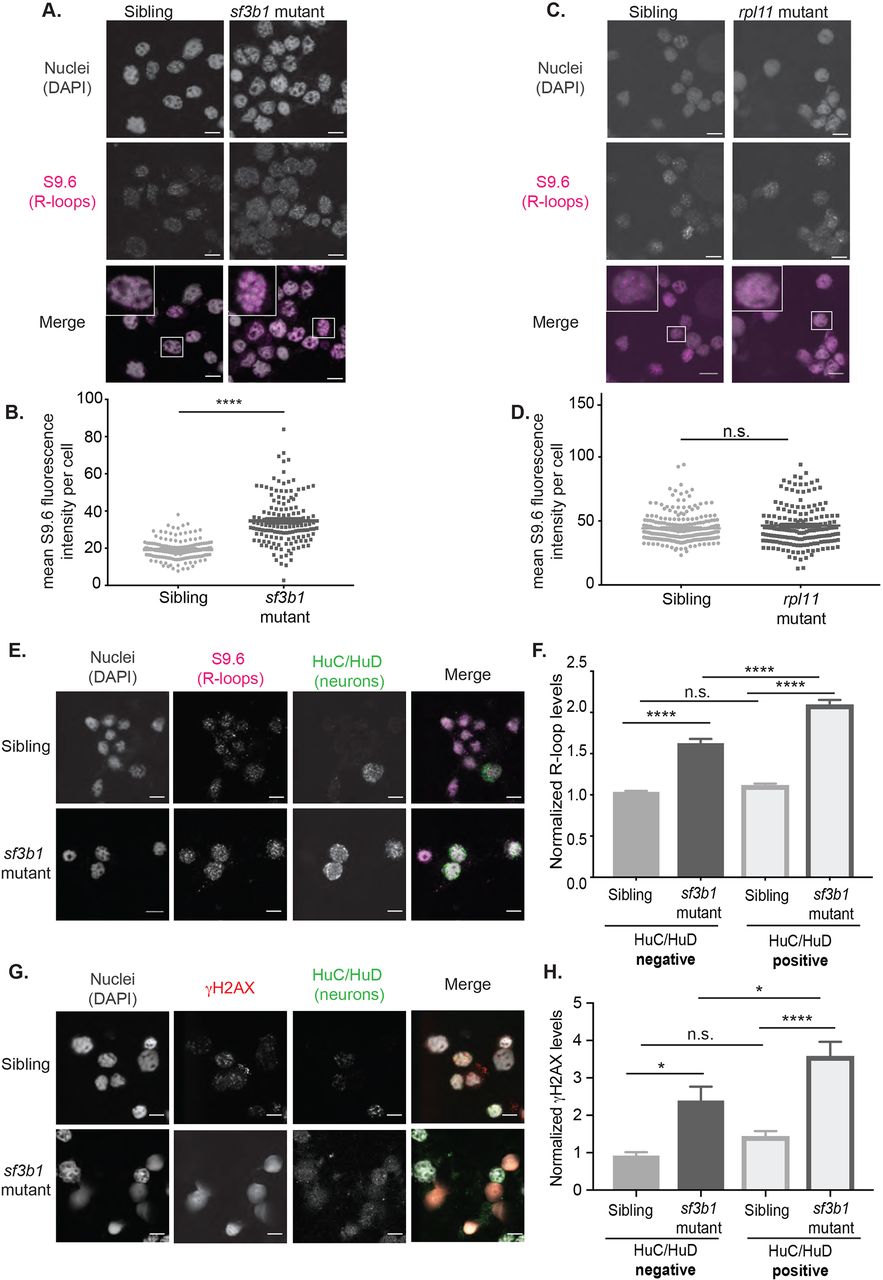
Fig. 3
R-loop levels are increased in spliceosomal mutant zebrafish. (A) Immunofluorescence confocal images of nuclei (DAPI) and R-loops (S9.6) in cells isolated from 24 hpf sf3b1hi3394aTg mutants and their wild-type siblings. The lower panel is a merged image with an inset of a single cell to better show R-loop patterns. (B) Quantification of R-loop levels in A. Each dot represents R-loop levels for a single cell. P-value calculated by t-test with Welch's correction. (C,D) R-loop levels in rpl11hi3820bTg mutants were measured as in A and B. (E) Co-staining of R-loops with the pan-neuronal marker HuC/HuD in single cells isolated from 24 hpf sf3b1hi3394aTg mutants and their wild-type siblings. (F) Quantification of R-loop levels in HuC/HuD-positive and HuC/HuD-negative cells. (G) Co-staining of γH2AX and HuC/HuD. (H) Quantification of γH2AX fluorescence intensity in HuC/HuD-positive and HuC/HuD-negative cells. For all graphs, error bars represent the s.e.m. For images, 63× magnification with 6.5× zoom. Scale bar: 5 μm. For F and H, P-values were calculated by one-way ANOVA with Sidak's multi-testing correction. *P<0.05; **P<0.01; ***P<0.001; **** P<0.0001; n.s., not significant. Data represent normalized values across three replicates.