
|
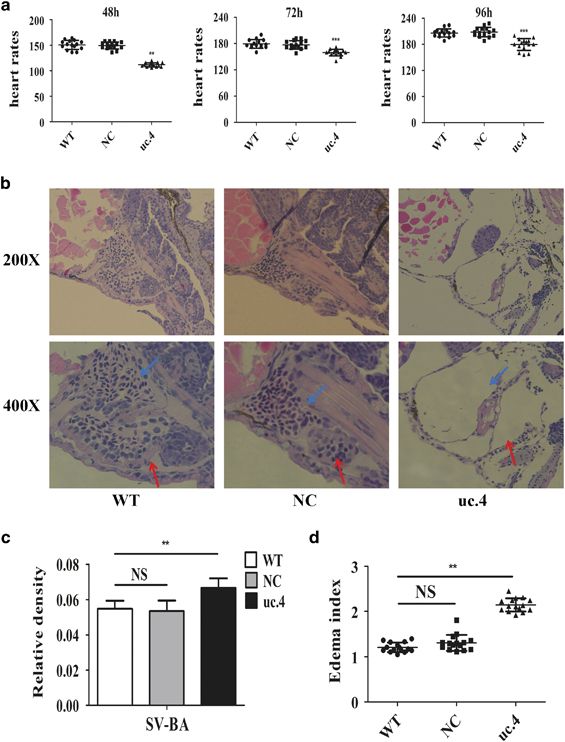
Fig. 5
Cardiac function and histological changes. (a) The overexpression of uc.4 decreased the heart rates of zebrafish embryos. (b) Histological sections of the heart showed a thinner ventricular wall and smaller valve structure compared to control embryos. Red arrows: ventricle. Blue arrows: atrium. (c) SV–BA distance, which is normalized to total body length, resulting in a ratio. The SV–BA was increased in the overexpression group compared with the WT group. (d) The edema index was increased in the overexpression group compared with the WT group. **P<0.01, ***P<0.001 versus WT groups, Student’s t-test. Each experiment was repeated three times. Data are presented as the means±s.d. SV–BA, distance between the sinus venous and the bulbus arteriosus; WT, wild type.