
Image
|
Figure Caption
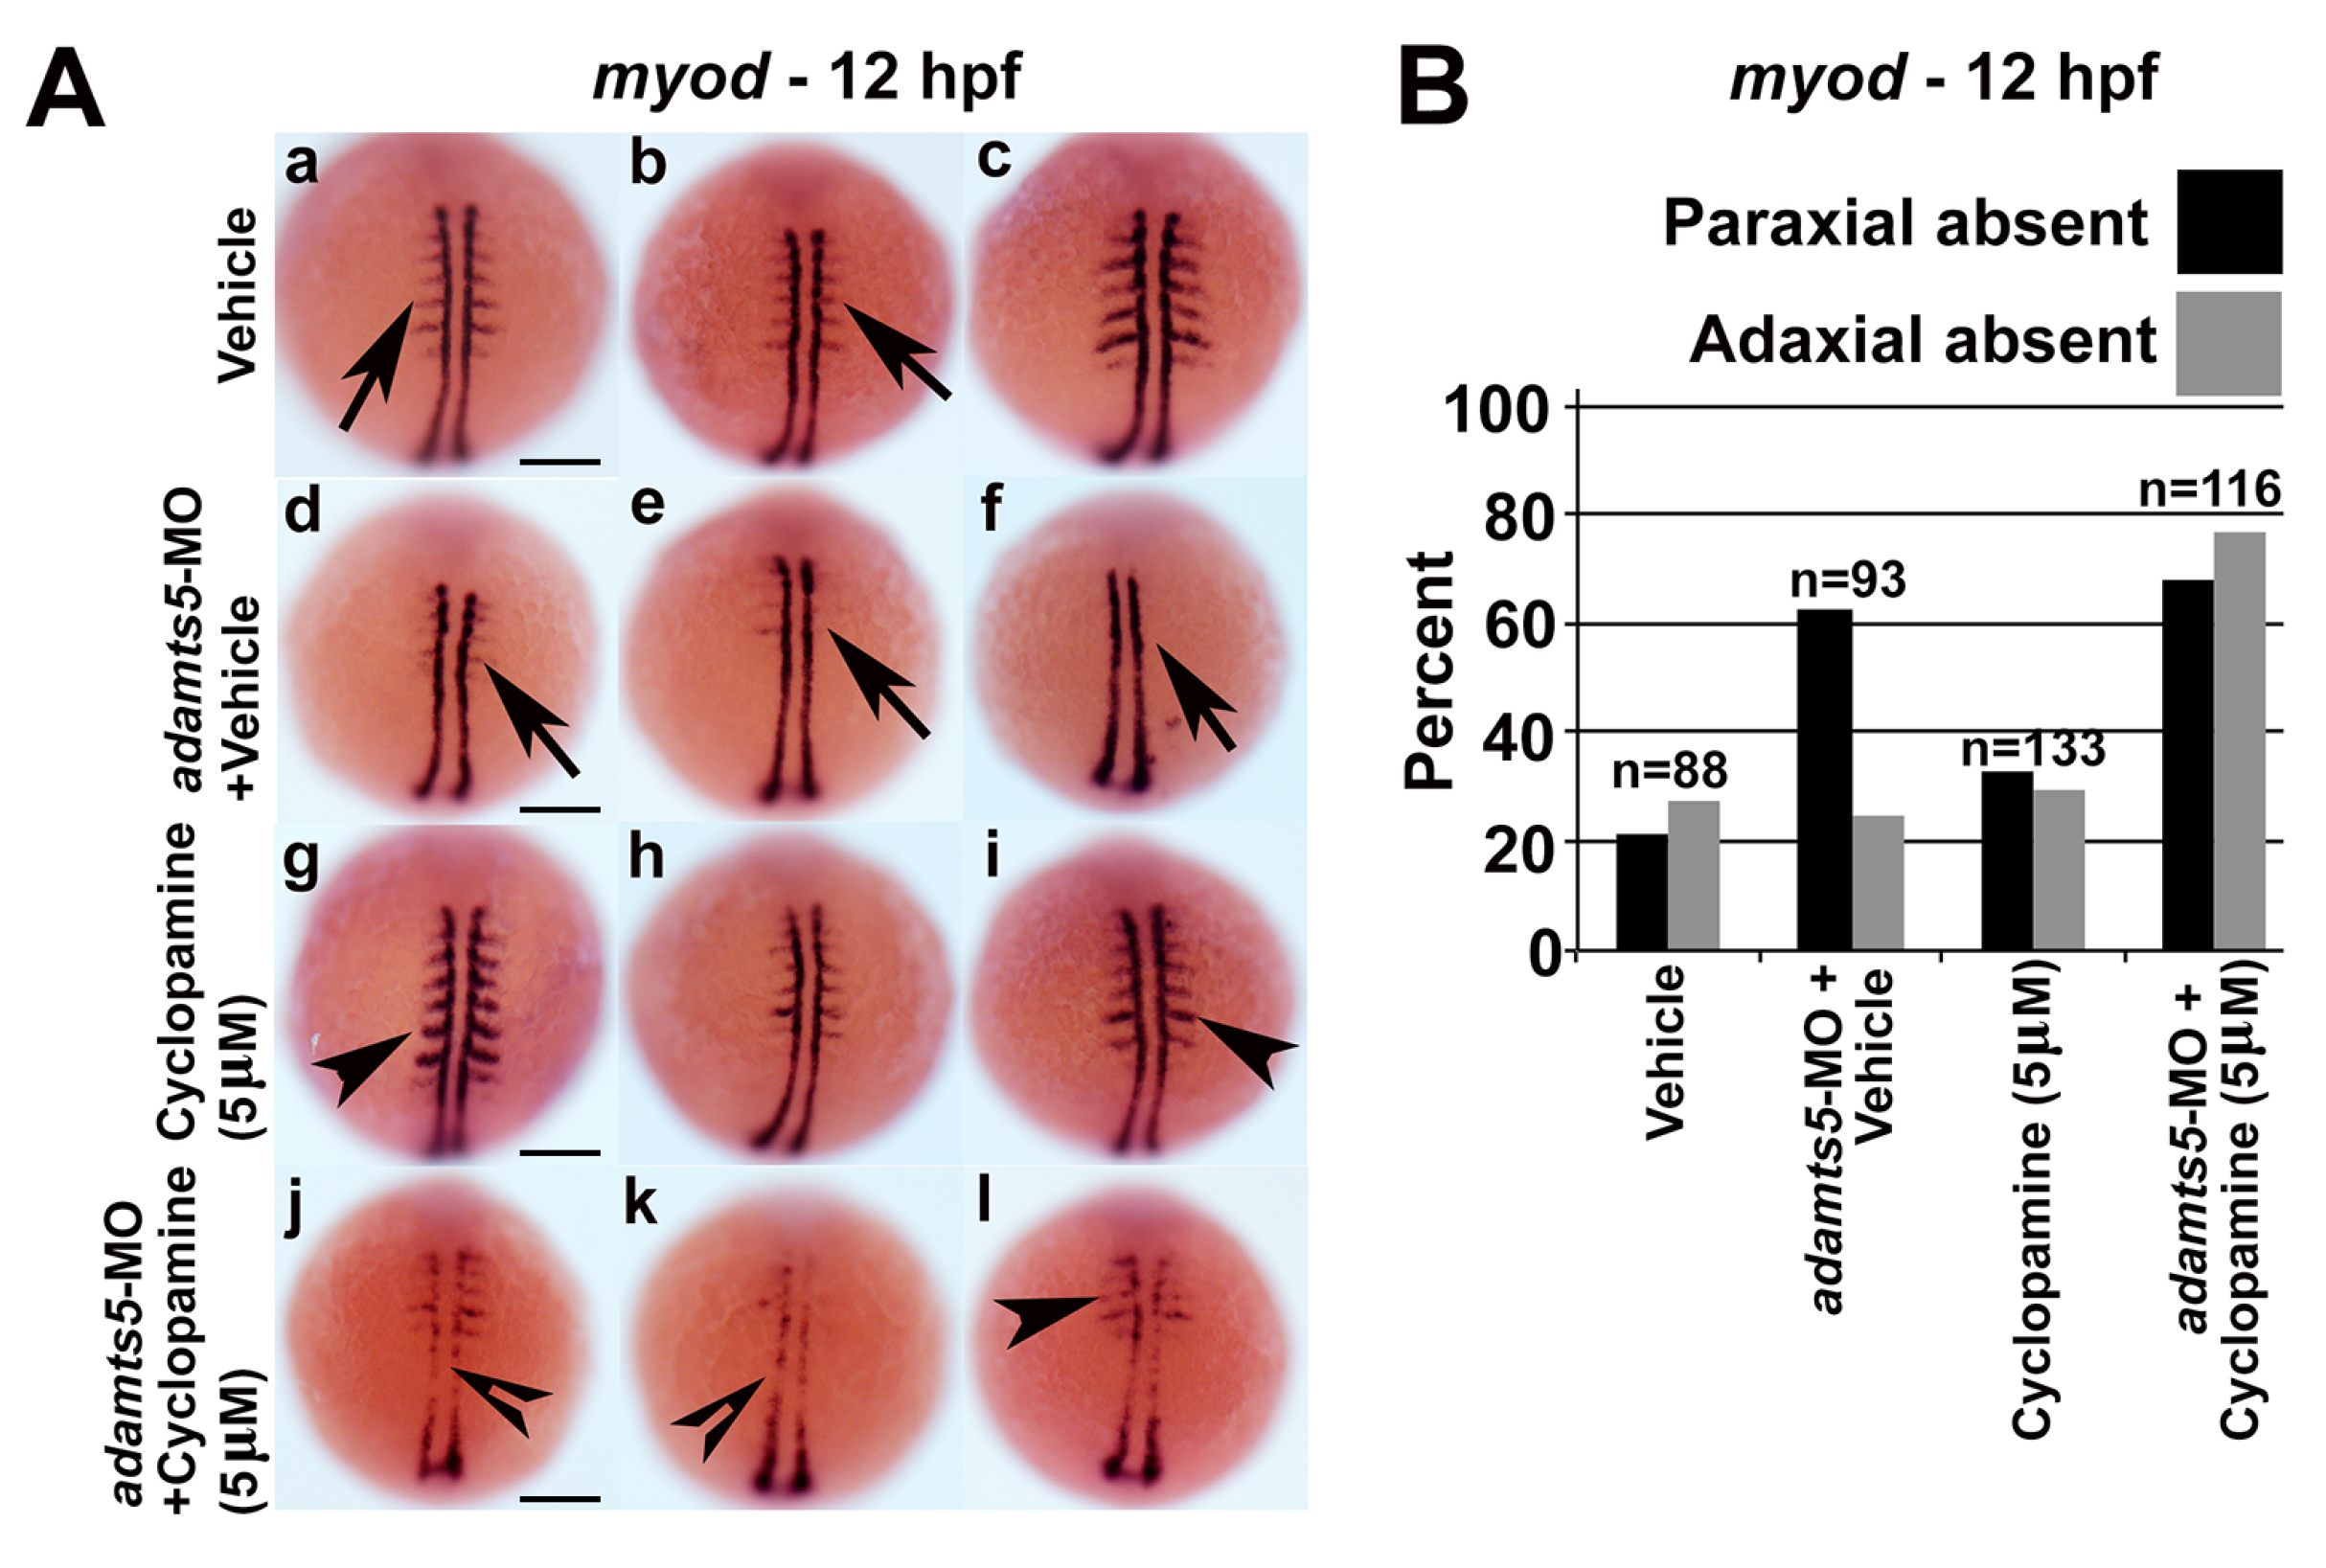
Fig. 4
Combinatorial inhibition of Shh signaling and adamts5 disrupt paraxial and adaxial myod expression. (A) Adaxial and paraxial myod expression in 12 hpf embryos treated with vehicle control (a–c, arrows denote paraxial myod expression), vehicle + adamts5-MO (d–f, arrows denote absent paraxial myod expression), 5 μM cyclopamine (g–i, arrowheads represent similar paraxial myod staining compared to control group) and 5 μM cyclopamine + adamts5-MO (j–l, open arrowheads represent absent adaxial myod expression and arrowhead represents absent paraxial myod staining compared to adamts5 MO group). Scale bar = 200 μm; (B) Quantitation of embryos showing present or absent myod patterning represented in (A).
Acknowledgments
This image is the copyrighted work of the attributed author or publisher, and
ZFIN has permission only to display this image to its users.
Additional permissions should be obtained from the applicable author or publisher of the image.
Full text @ Int. J. Mol. Sci.