
|
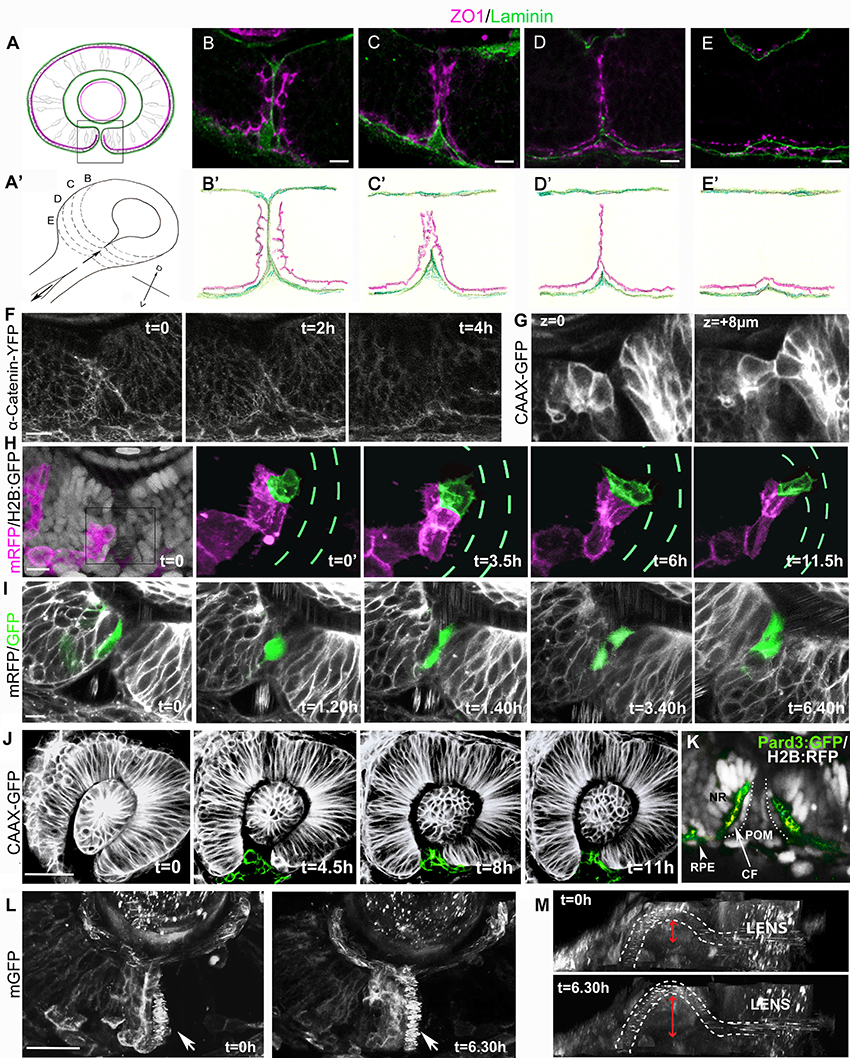
Fig. 1
Cell organization and behavior during choroid fissure fusion. (A) Schematic showing the optic cup in parasagittal section at the level of the lens just prior to choroid fissure fusion. The cells lining the fissure margins are continuous with the retinal pigmented epithelium and approach each other with their basal surfaces (green) facing the fissure and their apical surfaces (magenta) at the sub-retinal space (ventricular lumen of the optic vesicle). Boxed region corresponds to retinal regions shown in (B–I). Dorsal is up. (A') Schematic view of the optic cup midway through choroid fissure fusion. Letters (B–E) correspond to the positions of schematics/sections in (B–E, B'–E'). (B–E) Sections through the choroid fissure during fusion showing apically-located zonula occludens labeling (ZO1; magenta) and the basal lamina component Laminin (green) in the ventral retina of a 44 hpf embryo. (B'–E') Schematic of progressive steps in choroid fissure fusion process based on analysis of eyes from 8 embryos at 44 hpf (as in B–E). (F–L) Various views of the closing choroid fissure with transgenic lines analyzed or protein derived from injected RNA indicated to the left of the panels. (F) Image stills over a 4 h period from a 10 h time-lapse movie (Movie S1) from 34 to 44 hpf of Tg(ctnna:citrine)ct3aGT labeling of α-catenin-labeled adherens junctions in the fusing choroid fissure. (G) Z-stack images at two depths of the choroid fissure showing cell shapes just prior to and at the point of fusion in a 44 hpf eye. (H) Image stills over 11.5 h from a time lapse movie (Movie S3) from 34 to 45.5 hpf showing transplanted cells expressing mRFP (magenta) in an eye in which all cells are expressing nuclear H2B-GFP (gray in t = 0); one cell located in the fissure has been pseudocolored in green and the H2B-GFP fluorescence removed from the four panels on the right. Green dashes highlight the position of the fissure (visible when viewing H2B-GFP expression). (I) Image stills over 6 h 40 m from a 12 h time lapse movie (Movie S4) from 34 to 46 hpf showing transplanted cells in the fissure expressing cytoplasmic-GFP in an eye expressing mRFP. The fissure cell divides once during the course of the movie. (J) Image stills over 11 h from a 12 h time lapse movie (Movie S5) from 26 to 38 hpf showing POM cells expressing CAAX-GFP (pseudocolored in green). (K) Image of the choroid fissure prior to fusion showing apically-located GFP-tagged Pard3 labeling (green) and nuclear staining (gray) in the ventral retina of a 40 hpf embryo. The image shows that cells lining the choroid fissure (CF) are in continuity with the retinal pigment epithelium (RPE) and the pseudo-stratified/stratified neural retina (NR). (L,M) Image stills over 6.5 h from a 12 h time lapse movie (Movie S6) from 34 to 46 hpf showing the superficial displacement of the hyaloid vessel during choroid fissure closure. The orientation in K is as other panels above; in L, the image has been rotated to give a lateral view into the fissure; the irregular spots inside the white dashed lines (outlining the hyaloid vessel) are a result of movement of blood cells. The superficial displacement of the vessel is shown by the red arrow. Scale bars: (B–I) ~10 μM; (J,K) ~30 μM.