
|
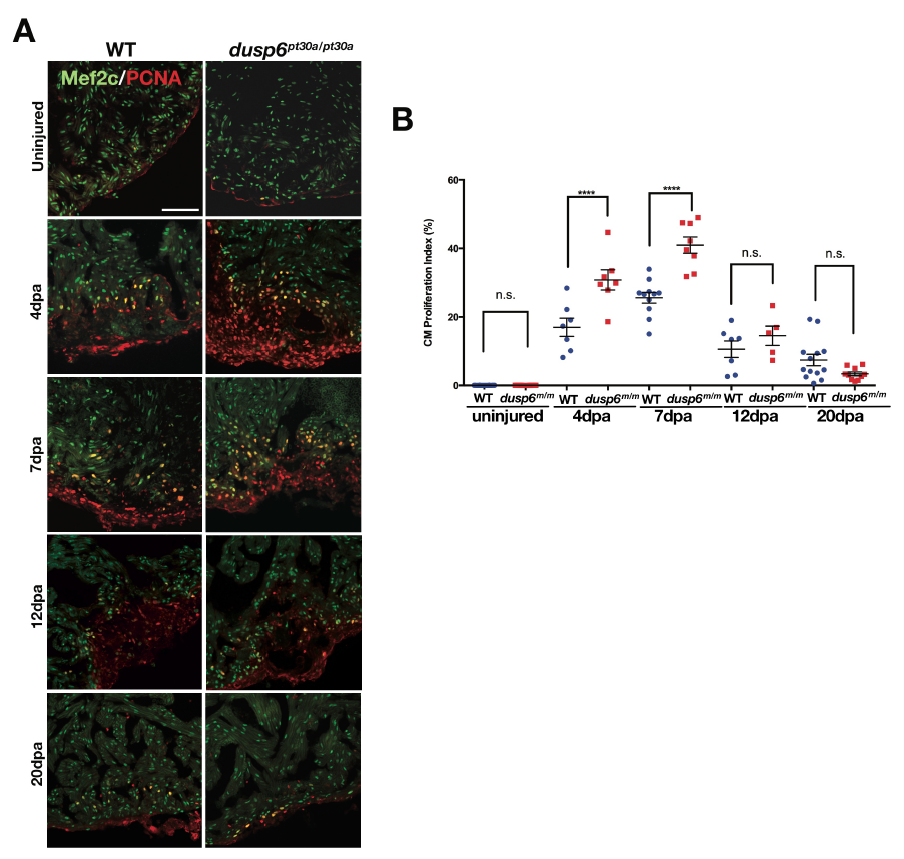
Fig. S5
dusp6 mutant hearts show increased cardiomyocyte proliferation after injury, but it is not indeterminate. (A) Hearts at 0- (WT n=24; dusp6pt30a/pt30a n=28), 4- (WT n=7; dusp6pt30a/pt30a n=7), 7- (WT n=11; dusp6pt30a/pt30a n=8) 12- (WT n=7; dusp6pt30a/pt30a n=5), and 20 dpa (WT n=13; dusp6pt30a/pt30a n=10) immunostained for Mef2c and PCNA. dusp6 mutant hearts show increased proliferating cardiomyocytes at 4- and 7 dpa, but the proliferation index at 12- and 20 dpa is similar to WT hearts. (B) Graph representing the cardiomyocyte proliferation index at multiple time point between WT and dusp6 hearts. ****p<0.0001; n.s.=not significant. One-way ANOVA. Scale bars, 100 μm.