
|
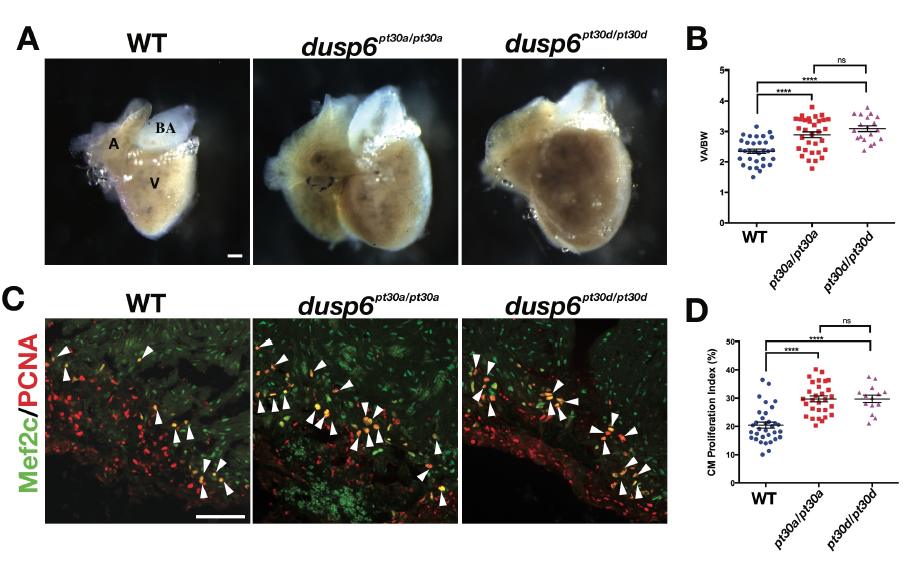
Fig. S4
dusp6pt30d/pt30d hearts show the same phenotype as dusp6pt30a/pt30a (A) Whole-mount images of adult WT (n=32), dusp6pt30a/pt30a (n=32), and dusp6pt30d/pt30d (n=19) hearts at 7 dpa. dusp6 mutant hearts show cardiomegaly. A=Atrium; V=Ventricle; BA=Bulbus Arteriosus (B) Quantification of the ratio ventricle area/body weight (VA/BW). dusp6 mutant fish exhibit larger VA/BW than WT fish. ****p<0.0001; n.s.=not significant. One-way ANOVA. (C) Zebrafish hearts at 7 dpa, immunostained for Mef2c and PCNA. dusp6pt30a/pt30a (n=29) and dusp6pt30d/pt30d heart (n=14) show increased cardiomyocyte proliferation compared to WT hearts (n=33). (D) Quantification of cardiomyocyte proliferation index. ****p<0.0001. n.s.=not significant. One-way ANOVA. Scale bars, 100 μm.