
|
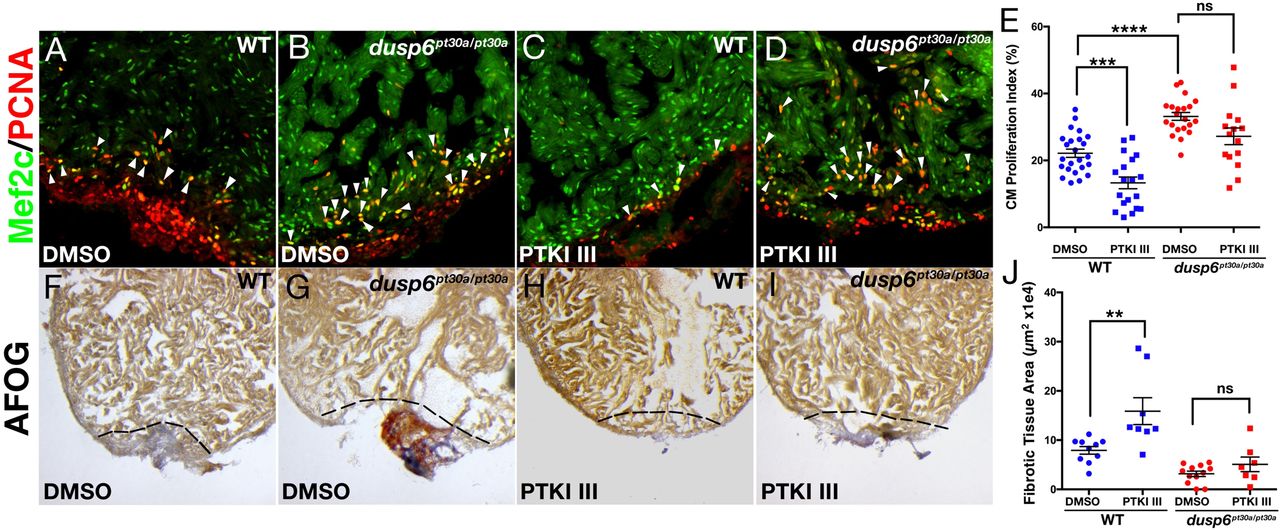
Fig. 6
dusp6 mutant hearts are mildly affected by PDGFR inhibition. (A-D) Hearts at 7 dpa were injected for 6 days with PTKI III (C,D) or vehicle DMSO (A,B) and stained for Mef2c and Pcna to determine cardiomyocyte proliferation. WT hearts (DMSO, n=22; PTKI III, n=19) (A,C) and dusp6pt30a/pt30a hearts (DMSO, n=21; PTKI III, n=15) (B,D). Arrowheads indicate proliferating cardiomyocytes. (E) Quantification of cardiomyocyte proliferation in WT and dusp6 mutant hearts after injection of PTKI III or DMSO. Each point represents the average proliferation index from one heart. (F-I) AFOG staining of WT or dusp6pt30a/pt30a hearts at 20 dpa injected for 6 days with PTKI III (WT, n=8; dusp6pt30a/pt30a, n=12) (H,I) or DMSO (WT, n=10; dusp6pt30a/pt30a, n=7) (F,G). Dashed line demarcates injury zone. (J) Quantification of fibrotic tissue area in hearts at 20 dpa. (E,J) ****P<0.0001, ***P<0.001, **P<0.01; ns, not significant; one-way ANOVA.