
|
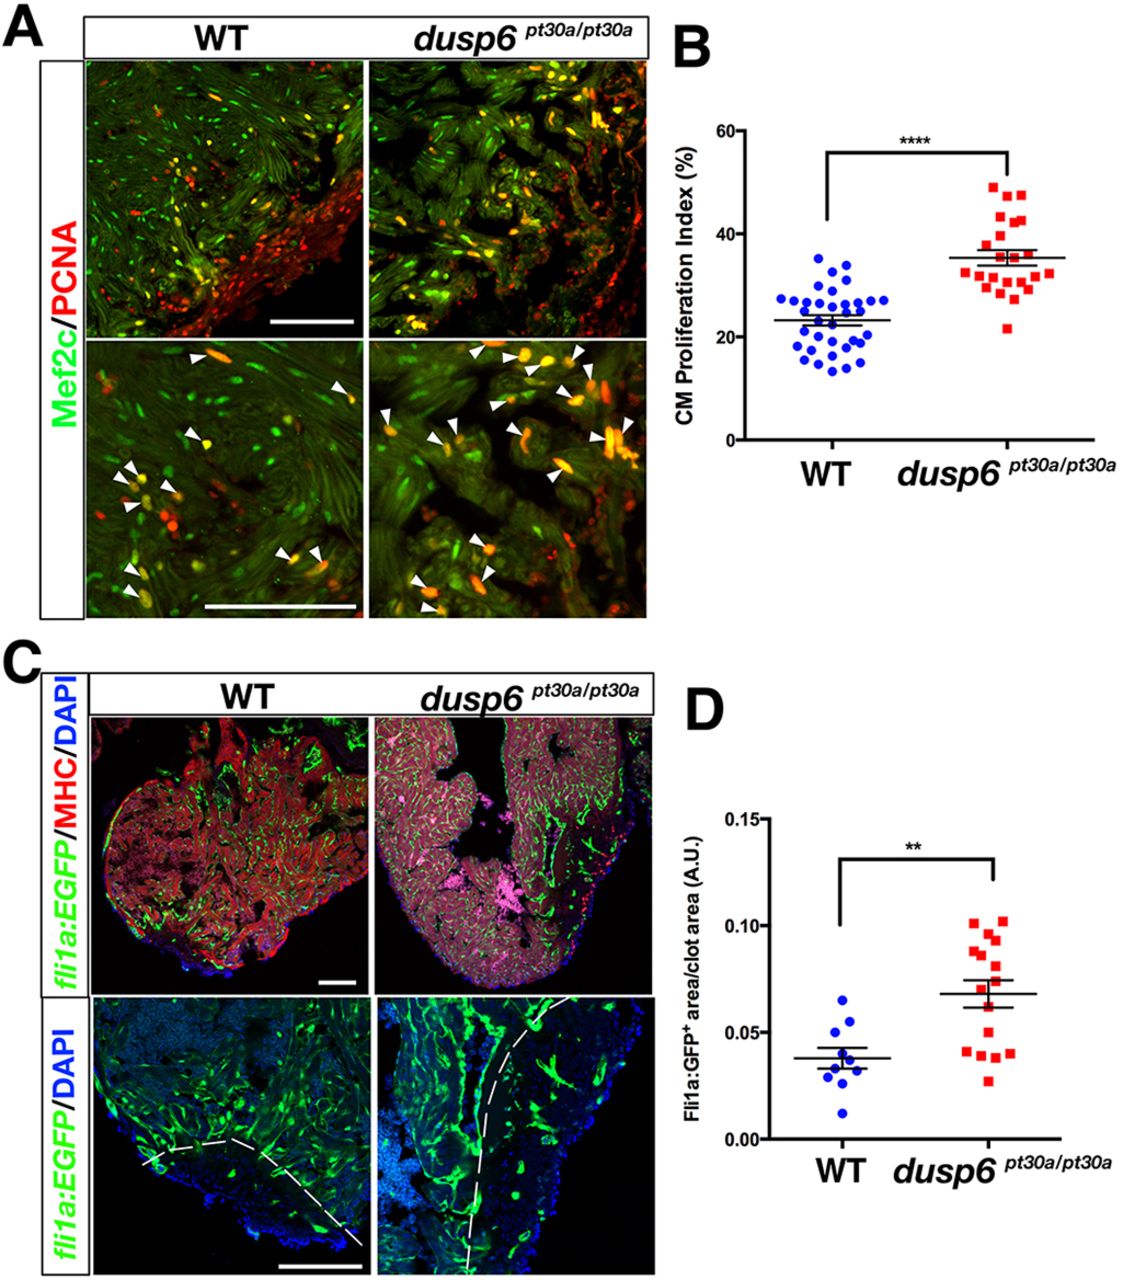
Fig. 3
Increased cardiomyocyte proliferation and angiogenesis in dusp6 mutant hearts after cardiac injury. (A) Hearts at 7 dpa, immunostained for Mef2c (green; cardiomyocyte nuclei) and Pcna (red; proliferation marker). Cardiomyocyte proliferation is increased in dusp6 mutant hearts (n=23) compared with WT hearts (n=35). Arrowheads indicate proliferating cardiomyocytes. (B) Quantification of cardiomyocyte proliferation index in WT and dusp6 mutant hearts. ****P<0.0001, Student's t-test. (C) EGFP+ vessels were visualized in Tg(fli1a:EGFP)y1; dusp6pt30a/pt30a (n=16) and Tg(fli1a:EGFP)y1 (n=10) hearts at 8 dpa. Dashed line demarcates the resection plane. (D) Quantification of new vessels formed inside the clot area of hearts at 8 dpa. **P<0.01, Student's t-test. Scale bars: 100 µm.