
Image
|
Figure Caption
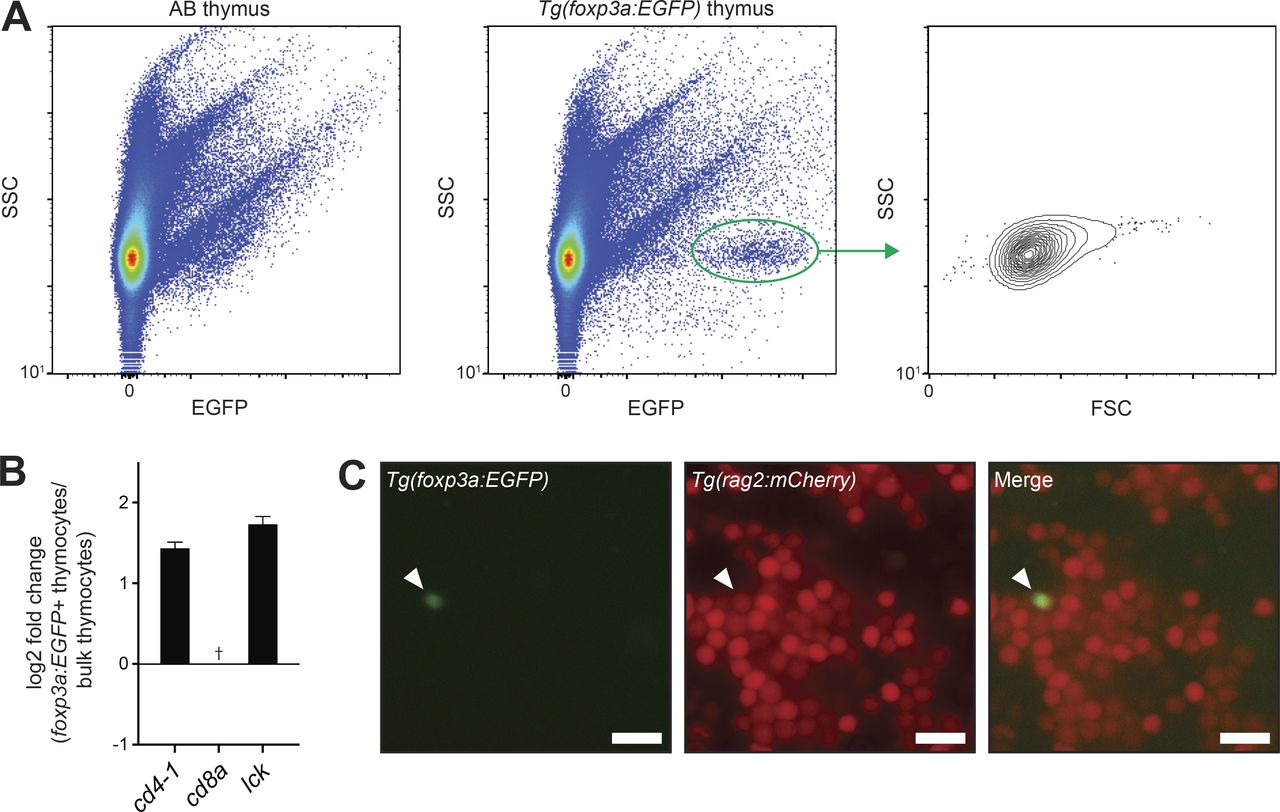
Fig. 2
Identification and analysis of foxp3a:EGFP-positive thymocytes. (A) Flow cytometry analysis of thymus from representative AB and Tg(foxp3a:EGFP) animals. (B) qRT-PCR of selected genes in foxp3a:EGFP-positive thymocytes relative to bulk thymocytes. Relative CD4 and CD8 expression is also shown and represents zebrafish cd4-1 and cd8a genes. †, Expression of cd8a was below the limit of detection in foxp3a:EGFP-positive thymocytes. Error bars indicate SEM.; n = 3. (C) Cells from dissected thymus of a Tg(foxp3a:EGFP); Tg(rag2:mCherry) animal showing a double-positive thymocyte (arrowheads). Bars, 10 µm.
Figure Data
Acknowledgments
This image is the copyrighted work of the attributed author or publisher, and
ZFIN has permission only to display this image to its users.
Additional permissions should be obtained from the applicable author or publisher of the image.
Full text @ J. Exp. Med.