
|
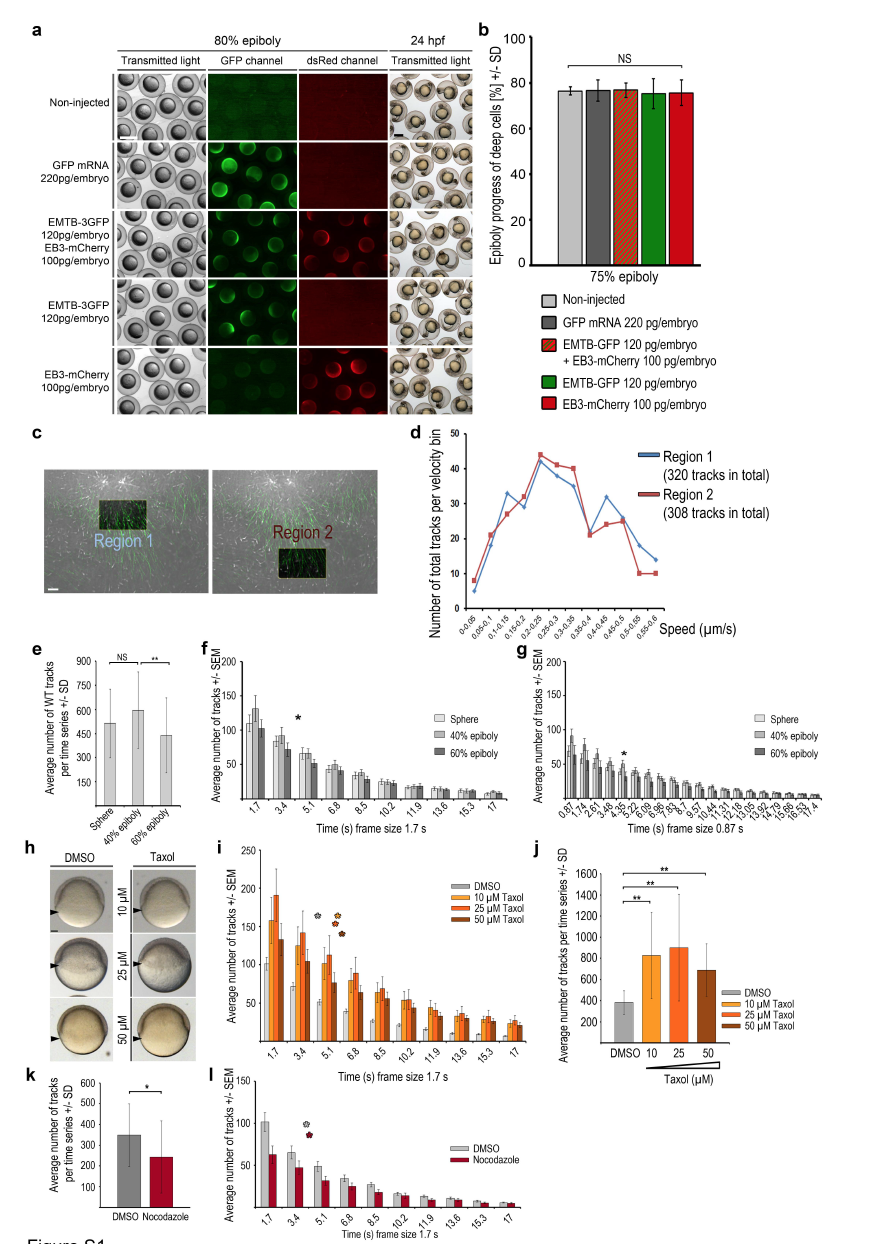
Fig. S1
Measurements of microtubule dynamics in wild-type embryos and embryos treated with microtubule interfering drugs
(a, b) EMTB-3GFP and EB3-mCherry overexpression did not impair epiboly progression. (a) Comparison of live wild-type embryos at 80% epiboly, non-injected or injected with mRNAs encoding GFP, EMTB-3GFP plus EB3-mCherry, EMTB-3GFP alone, or EB3-mCherry alone (rows from top to bottom), imaged with transmitted light (left column), for GFP- (middle column), or dsRedfluorescence (right column). Live non-injected or mRNA injected wild-type embryos at 24 hpf imaged with transmitted light (right column) reveal normal embryogenesis of labeled embryos. Scale bar 500 μm.
(b) Quantification of epiboly progression in experiment shown in (a). Error bars indicate SD. Epiboly progression of mRNA injected embryos was not significantly (NS) different compared to non-injected control embryos (Mann-Whitney test) (non-injected: n = 9 embryos, mRNA injected: GFP n = 9, EMTB-3GFP + EB3-mCherry n = 8, EMTB-3GFP n = 10, EB3-mCherry n = 9).
(c, d) EB3-mCherry comet number or track distribution are not biased by minor differences in positioning the analysis frame in the YCL. Manually defined areas might slightly differ in their position in the YCL, potentially influencing microtubule dynamics measurements. Therefore, we compared analysis regions located right beneath an MTOC with those positioned more vegetally within the same embryo. (c) Same TRIF images of live wild-type YCL region at sphere labeled with EMTB-3GFP (green) and EB3-mCherry (white). Left image: square marks highlighted ”Region 1” just below the most vegetal MTOC. Right image: square marks highlighted ”Region 2” at a more vegetal position. Region size each 24 μm x 15 μm. Selected image of a time series (1.7 s per frame, 83.3 s in total). Scale bar 5 μm. Both regions contained a similar number of tracked EB3-mCherry comets in each analyzed embryo.
(d) Growth speed of EB3-mCherry tracks present in regions 1 or 2 of images shown in (c) was binned into speed intervals (bin size 0.05 μm/s) and the number of tracks in each bin plotted. Track velocity distributions were not significantly different between the two analyzed regions.
(e) Quantification of the average number of wild-type EB3-mCherry tracks at indicated stages. Error bars indicate SD. Same dataset analyzed as listed in Fig. 3c. Track numbers are not significantly (NS) different between sphere and 40% epiboly, but significantly reduced from 40% to 60% epiboly (p < 0.05, Mann-Whitney test).
(f) Distribution of duration of individual tracks with 1.7 s per frame recording. The average number of EB3-mCherry tracks with a given duration of frames plotted over track duration (x-axis determined by frame time intervals) at indicated stages. Asterisk marks average half-life of the tracks during the time series, 83.3 s in total (calculated with ln(2)/λ = 4.1 s; decay constant λ taken from exponential trend line equation calculated by Excel). At average half-life, the quantity of tracks fell to one half of its initial value (average number of tracks at time point of average half-life: sphere 217 tracks, 40% epiboly 241 tracks, 60% epiboly 198 tracks). Error bars indicate SEM. Same dataset analyzed as in Fig. 3c.
(g) Distribution of duration of individual tracks with 0.87 s per frame recording. The average number of EB3-mCherry tracks with a given duration of frames plotted over track duration (x-axis determined by frame time intervals) at indicated stages. Asterisk marks average half-life of the tracks during the time series, 83.3 s in total (calculated with ln(2)/λ = 4.35 s; decay constant λ taken from exponential trend line equation calculated by Excel). At average half-time the quantity of tracks fell to one half of its initial value (average number of tracks at time point of average half-life: sphere 261 tracks, 40% epiboly 307 tracks, 60% epiboly 217 tracks). Error bars indicate SEM. Same dataset analyzed as in Fig. 3c. Data in Figures S2b and c reveal that the measurement of track duration is not affected by frame duration in the range of recording frequencies used.
(h) Live images at 50% epiboly of wild-type embryos treated from 2 hpf onward with DMSO (left column) or Taxol at 3 concentrations (right column). Arrowheads mark blastoderm margin. Lateral view, animal to the top. Scale bar 100 μm.
(i) Distribution of duration of individual EB3-mCherry tracks per frame for recordings of DMSO controls (grey bars) or Taxol treated wild-type embryos (3 concentrations: yellow, orange, brown bars) at 60% epiboly. Tracks with a given duration of frames plotted over track duration (x-axis determined by time intervals). Color coded asterisks mark average half-life of the tracks during the time series (calculated with: DMSO: ln(2)/λ = 4 s; Taxol: 10 μM: ln(2)/λ = 5.6 s; 25 μM: ln(2)/λ = 5.4 s; 50 μM: ln(2)/λ = 5.9 s. Each decay constant λ was taken from exponential trend line equation calculated by Excel). Error bars indicate SEM. Same dataset analyzed as in Fig. 2b.
(j) Quantification of average EB3-mCherry track number per time series of DMSO and Taxol treated wild-type embryos at 60% epiboly. Error bars indicate SD. Same dataset analyzed as in Fig. 2b. A fixed area (41.7 x 31.26 μm) was analyzed for all conditions. Differences in track number are statistically significant (Mann-Whitney test) between DMSO and each tested Taxol concentrations (p < 0.005 for 10 μM and 50 μM; p < 0.05 for 25 μM).
(k) Quantification of the average EB3-mCherry track number per time series of DMSO or Nocodazole treated wild-type embryos at 40% epiboly. Error bars indicate SD. Same dataset analyzed as in Fig. 2h. Difference of track number between DMSO and Nocodazole treated embryo was significant (p < 0.05, Mann-Whitney test).
(l) Distribution of individual EB3-mCherry tracks per frame recording of DMSO (grey bars) or Nocodazole (red bars) treated wild-type embryos at 40% epiboly. Tracks with a given duration of frames plotted over track duration (x-axis determined by time intervals). Color coded asterisks mark average half-life of the tracks during the time series (calculated with: DMSO: ln(2)/λ = 3,7 s; Nocodazole: ln(2)/λ = 3,9 s. Each decay constant λ was taken from exponential trend line equation calculated by Excel). Error bars indicate SEM. Same dataset analyzed as in Fig. 2h.
Reprinted from Developmental Biology, 434(2), Eckerle, S., Ringler, M., Lecaudey, V., Nitschke, R., Driever, W., Progesterone modulates microtubule dynamics and epiboly progression during zebrafish gastrulation, 249-266, Copyright (2017) with permission from Elsevier. Full text @ Dev. Biol.