
|
Fig. S7
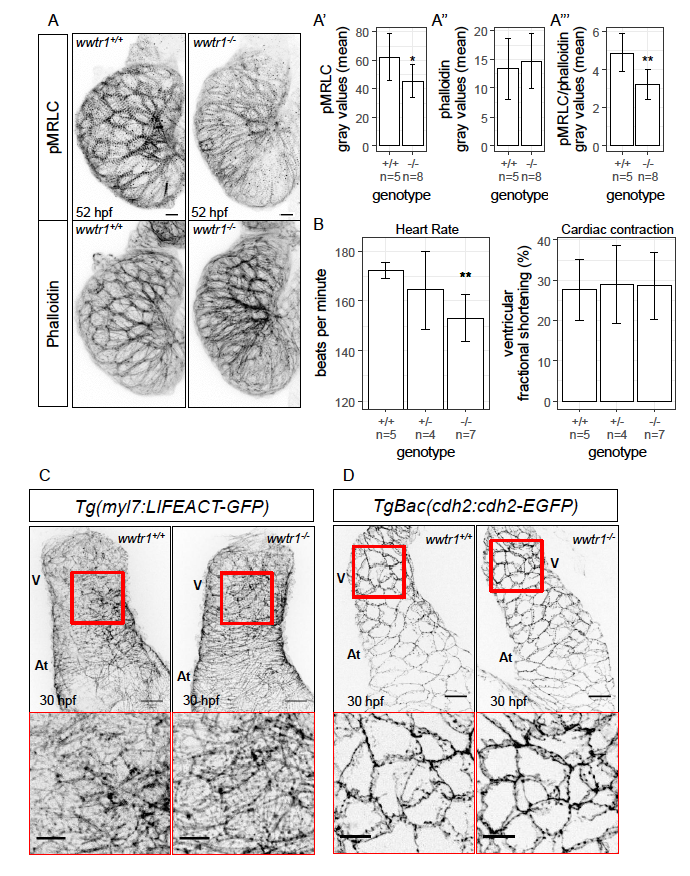
wwtr1-/- hearts exhibit decreased immunostaining intensity for phospho- MRLC and lower heart rate. (A) Maximum intensity projections of whole mount zebrafish hearts showing phospho-MRLC (pMRLC) and phalloidin stainings. Scale bars, 10 μm. The gray values of pMRLC are normalized to the gray values of phalloidin to correct for technical noise. Quantification of the mean pMRLC gray values (A’), mean phalloidin gray values (A’’), and normalized mean gray values of pMRLC (A’’’). Error bars are one unit of standard deviation. * - P < 0.05; ** - P < 0.01 by two-sample t-test. (B) Quantification of heart rate and ventricular fractional shortening at 52 hpf. Movies of beating hearts can be found in Movie S1. Error bars are one unit of standard deviation. ** - P < 0.01 by linear regression. (C) Maximum intensity projections of whole mount 30 hpf zebrafish hearts showing the expression pattern of LIFEACT-GFP in cardiomyocytes. Insets (demarcated in red) show high magnification views. The cardiomyocyte LIFEACT-GFP expression pattern is similar between wwtr1+/+ (n = 5) and wwtr1-/- (n = 6) hearts at this stage. (D) Maximum intensity projections of whole mount 30 hpf zebrafish hearts showing the N-cadherin-GFP localization in cardiomyocytes. Insets (demarcated in red) show high magnification views. The Ncadherin- GFP localization in cardiomyocytes is similar between wwtr1+/+ (n = 8) and wwtr1-/- (n = 7) hearts at this stage. Scale bars, 20 μm; 10 μm (insets). V - Ventricle; At - Atrium.