
Image
|
Figure Caption
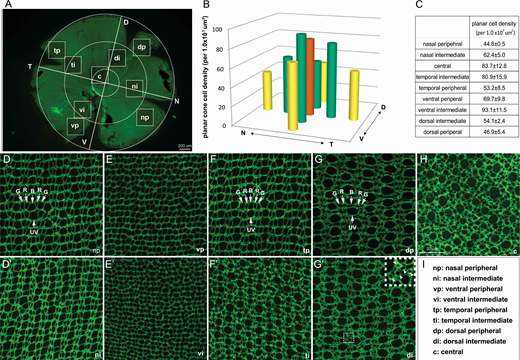
Fig. 4
Topographical variations in planar cone densities and sizes. (A) Flat-mounted adult zebrafish retina viewed at a low magnification to illustrate the nine sampled regions. (B, C) Average planar cone densities in nine local regions sampled from retinas at 6 mpf, n = 3. (D–H) Representative images of ZO-1 immunolabeled apical cell profiles (at the OLM) from the nine local retinal regions. Arrows indicate UV cones; R, red cones; G, green cones; and B, blue cones. (G') The inset shows a higher magnification of the boxed region. Round profiles of rods are marked by arrowheads. (I) Abbreviations of retinal regions.
Acknowledgments
This image is the copyrighted work of the attributed author or publisher, and
ZFIN has permission only to display this image to its users.
Additional permissions should be obtained from the applicable author or publisher of the image.
Full text @ Invest. Ophthalmol. Vis. Sci.