
|
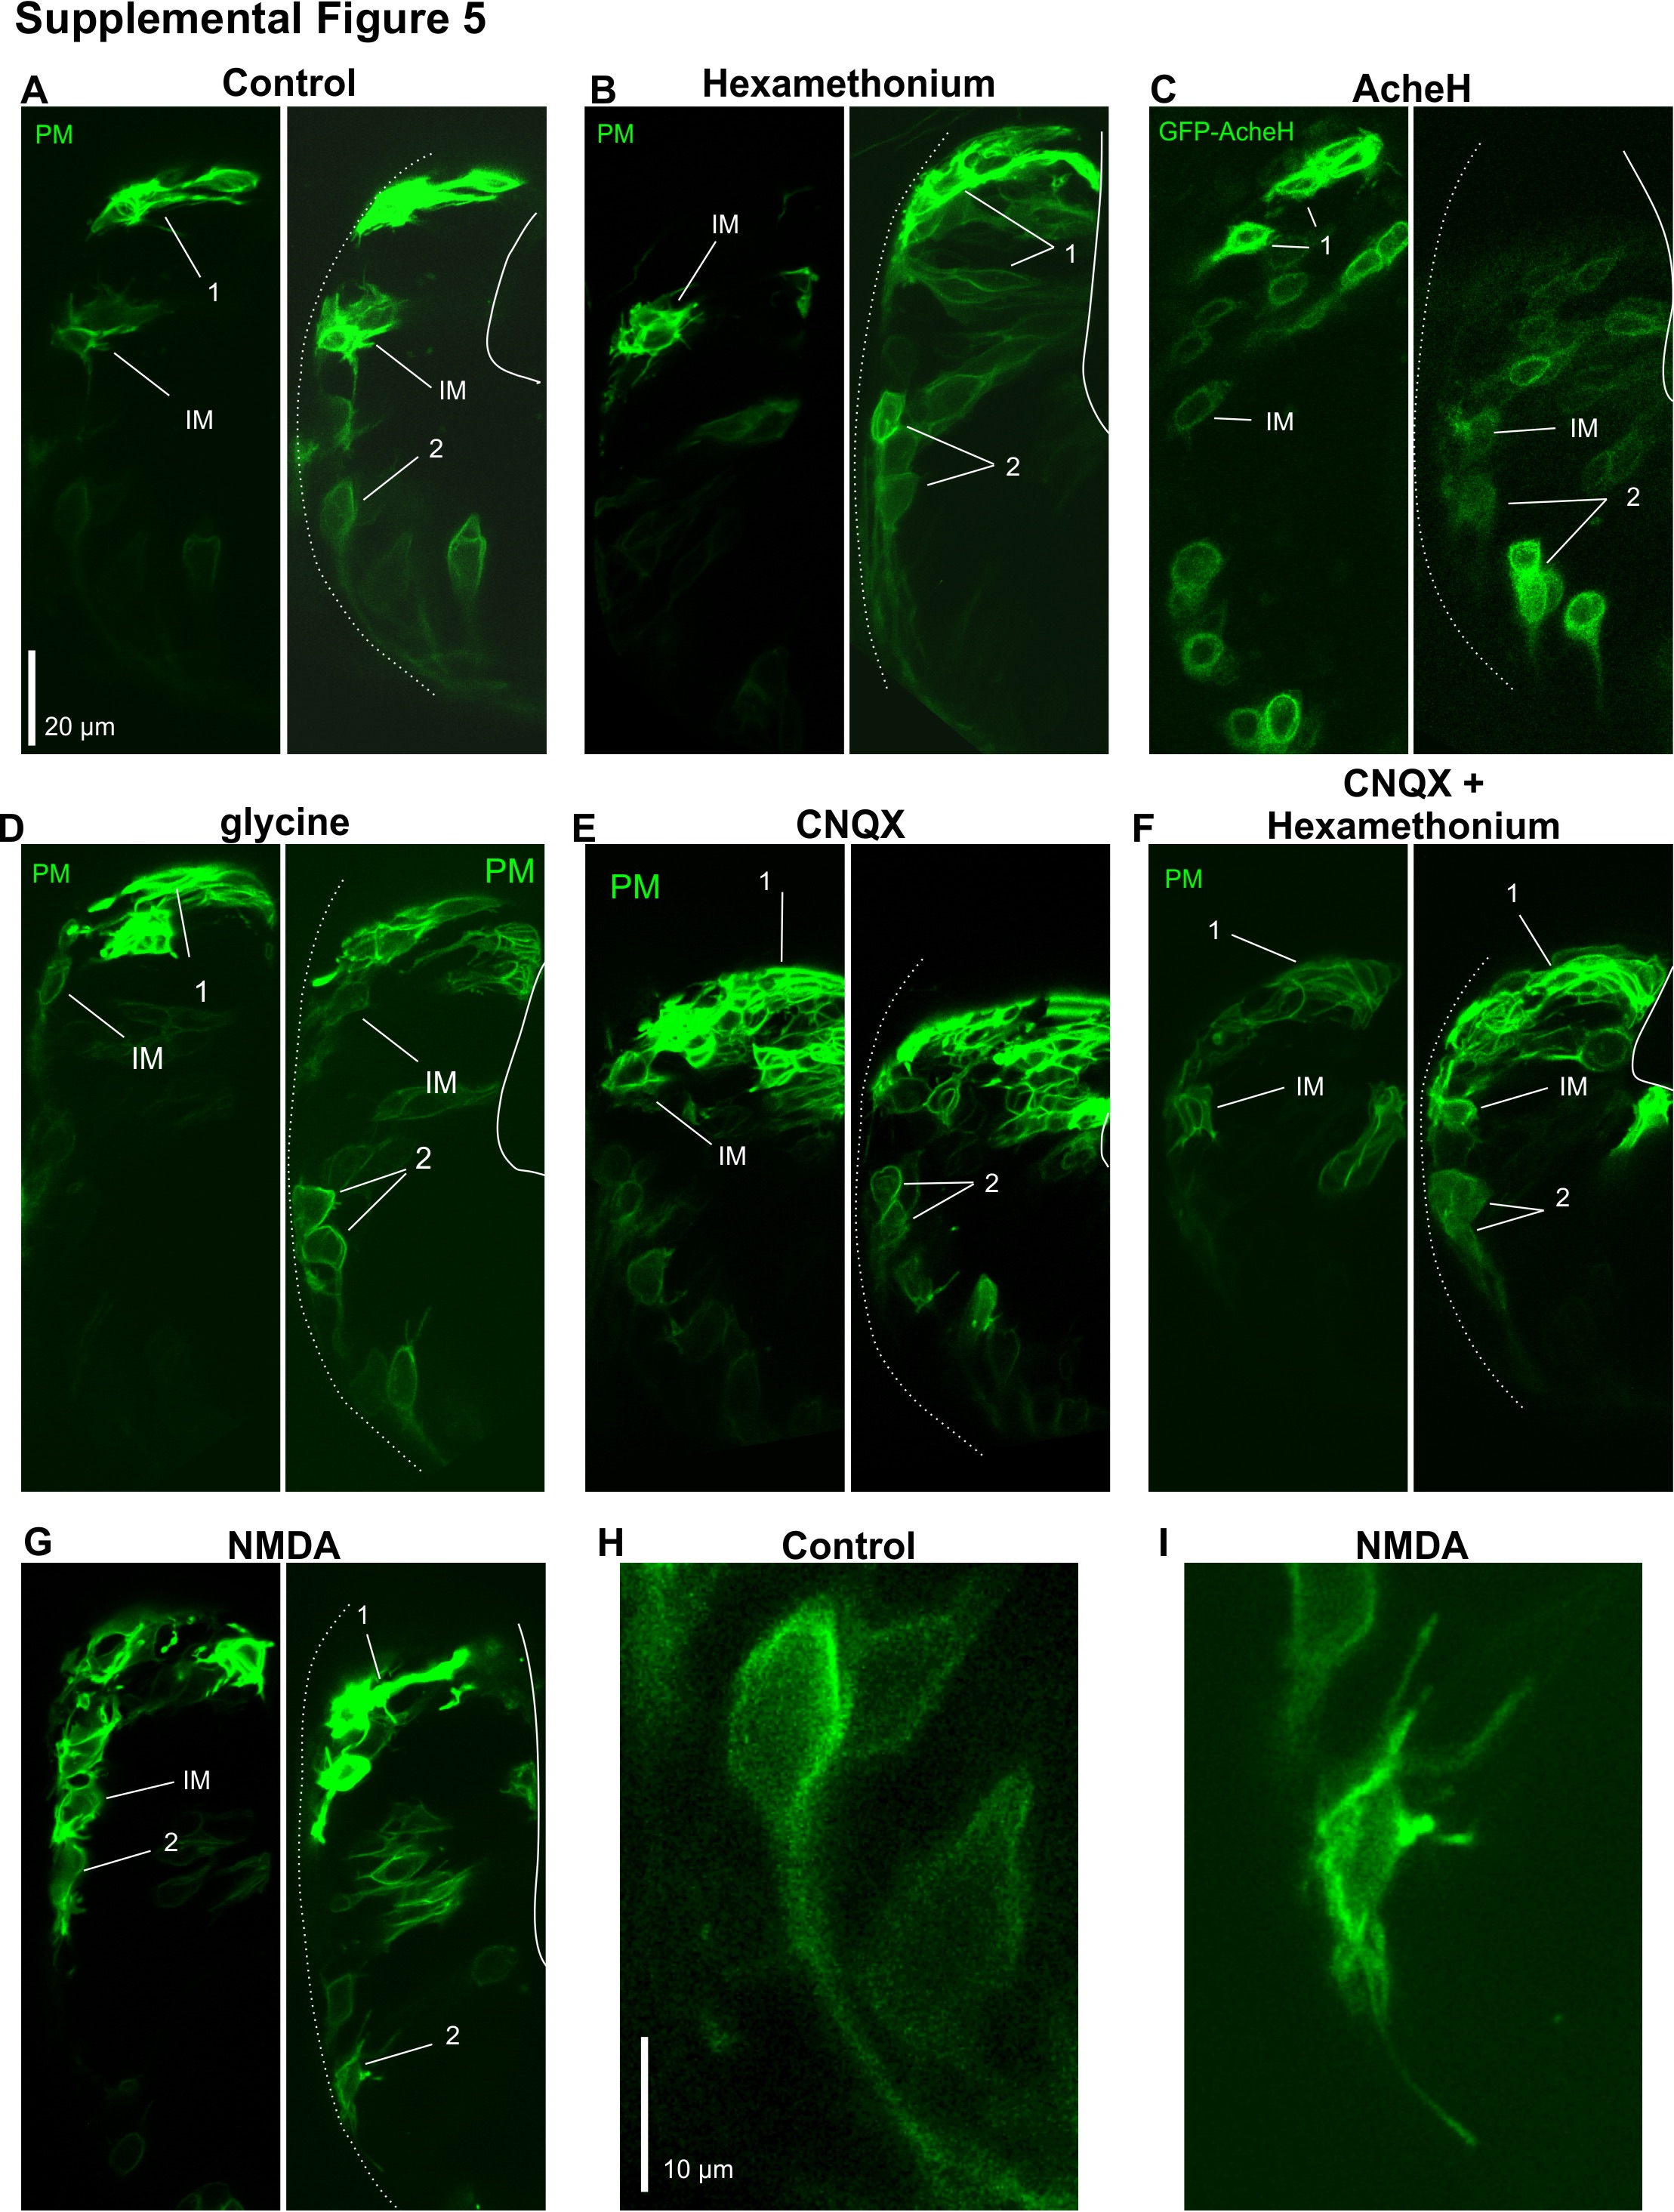
Fig. S5
(A) Control THNs treated with 1% DMSO exhibit the typical morphology of the different phases of migration. THNs expressed YFP-CAAX and are indicated by arrows and their migratory stage. Dotted line represents MHB, white line represents URL. Scale bar: 20 μm. (B) Hexamethonium does not change THN morphology, neither does the overexpression of GFP-AcheH (C). (D) Activating the glycine neurotransmitter system does not change THN morphology. (E) Neither CNQX nor (F) CNQX and hexamethonium treatment affect THN morphology (left and right panels). Adding NMDA (G), however, led to increased protrusions in ventrally located THNs (middle panel, compare to controls in Fig 4F). (H), (I) Magnification of THNs identified by “2” in (A) and (G) demonstrates the different morphologies in control (H) and excess NMDA (I) conditions Scale bar: 10 μm. CAAX, plasma membrane-targeting signal derived from K-Ras; CNQX, 6-cyano-7-nitroquinoxaline-2,3-dione; DMSO, dimethyl sulfoxide; MHB, midbrain-hindbrain boundary; NMDA, N-methyl-D-aspartate; THN, tegmental hindbrain nuclei neuron; URL, upper rhombic lip; YFP, yellow fluorescent protein.