
|
Fig. S3
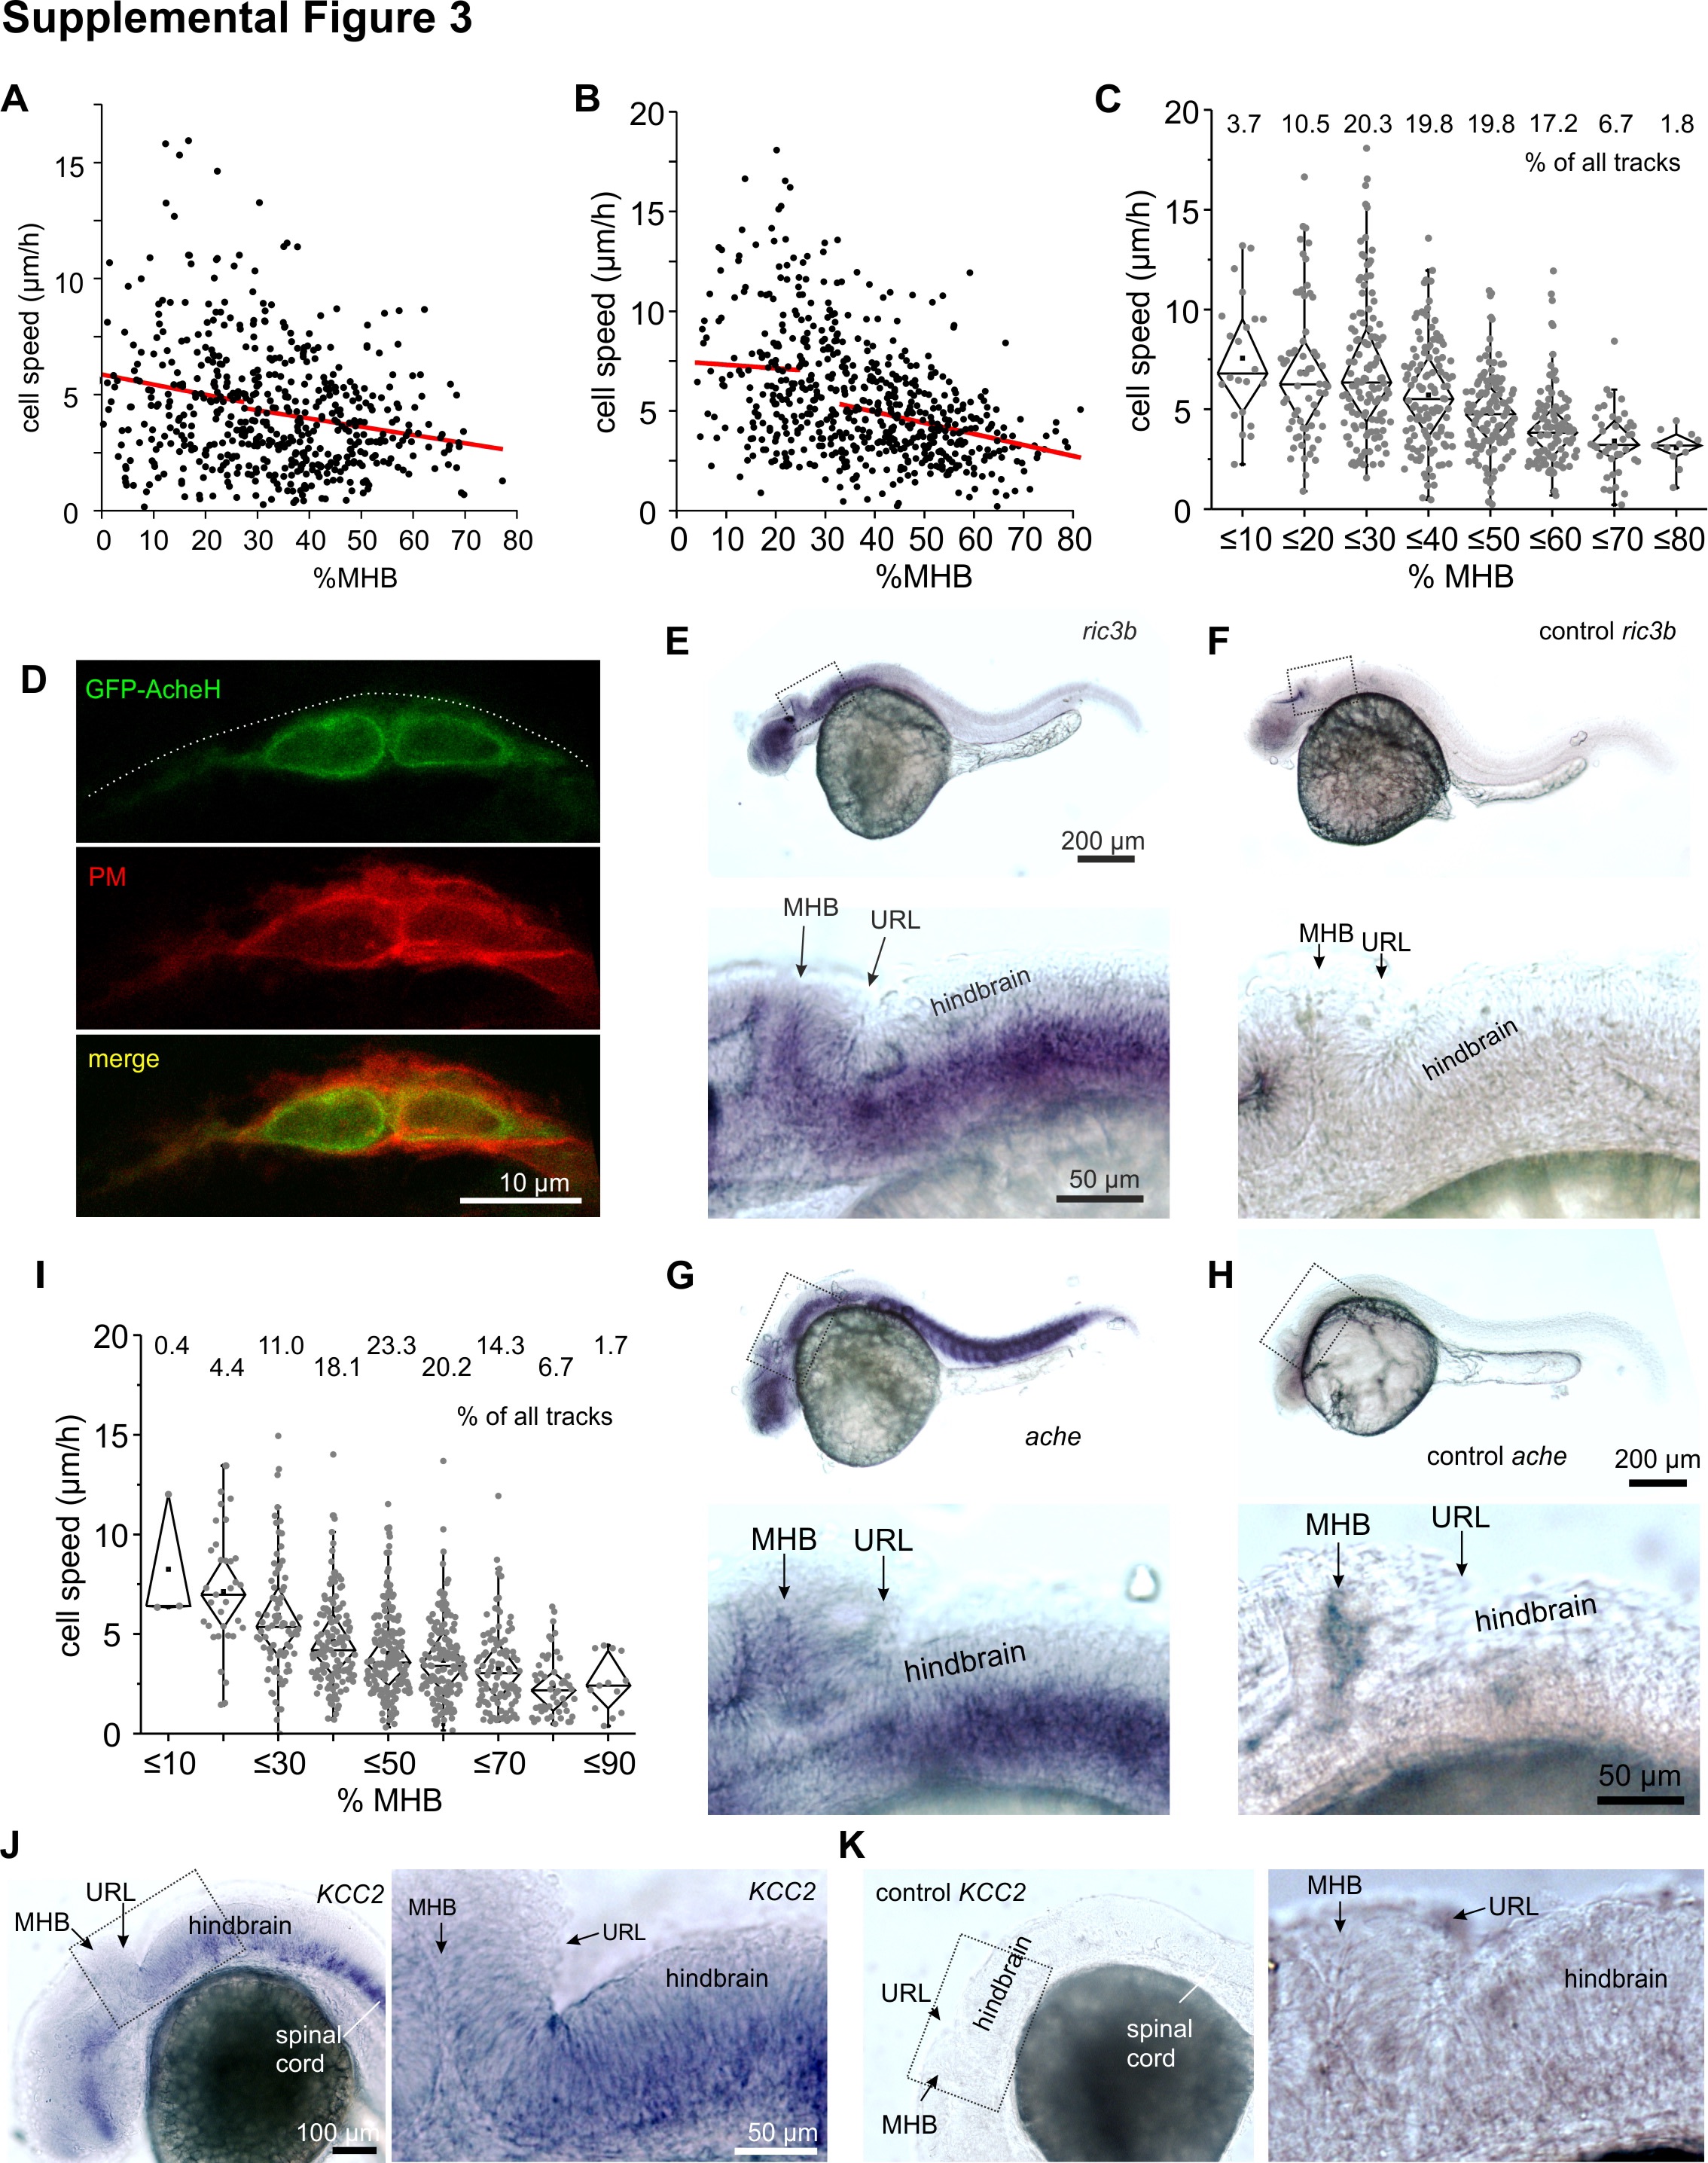
(A) Speeds from control THNs expressing YFP-CAAX migrating under the same illumination conditions as used in the optogenetic experiments are given as individual dots. Red lines represent the regression lines based on all values below or over the cutoff point 27.5% MHB. (B) Speeds from control THNs expressing GFP treated with 1% DMSO are given as individual dots. Red lines represent the regression lines based on all values below 25% MHB or over the 32.5% MHB. (C) THNs migrating under control conditions (1% DMSO) slow down from 25%–35% MHB as they progress ventrally. Track distribution is indicated at the top. (D) At high resolution, GFP-AcheH (top panel) appears to be present inside THNs as well as at the PM (middle). The overall morphology of these early phase 2 THNs appears unaffected. Scale bar: 10 μm. (E) WISH of a 30 hpf wt embryo stained for ric3b expression. This chaperone for nicotinic ACh receptors shows a strong expression in the brain. Box indicates the region magnified in the lower panel. Prominent anatomical features are indicated. Scale bars: 200 μm/50 μm. (F) Sense probe against ric3b is used as control for the staining shown in Figure S3E. Box indicates the region magnified in the lower panel. Major anatomical features are indicated. Scale bars: 200 μm, 50 μm. (G) WISH against ache shows strong staining in the muscles, the ventral hindbrain and a weaker staining in the cerebellum. This is more clearly seen in the magnified region in the second image. Anatomical features are annotated. Scale bars: 200 μm/50 μm. (H) As control, the sense probe against ache was used. Major anatomical features are indicated. Boxes indicate the magnified regions. Scale bars: 200 μm/50 μm. (I) Plots of every track in the glycine dataset along the MHB do not indicate the presence of subpopulations of THN cells with differential responses to glycine. The overall distribution of the tracks is indicated at the top. (J) Kcc2 (slc12a5b) is weakly expressed in the cerebellum at 30 hpf. Stronger staining can be observed in the ventral hindbrain and the spinal cord; image on the right is magnified region indicated in the left image. Prominent anatomical features are indicated. Scale bars: 100 μm/ 50 μm. (K) Sense probe was used as control for WISH against kcc2 (slc12a5b); image on the right is magnified region indicated in the left image. Prominent anatomical features are indicated. Scale bars: 100 μm/ 50 μm. Data depicted in the graphs can be accessed on the PLOS Biology Supplemental Information webpage (S2 and S3 Data). ACh, acetylcholine; AcheH, Ache GPI-anchored isoform H; CAAX, PM-targeting signal derived from K-Ras; DMSO, dimethyl sulfoxide; GFP, green fluorescent protein; hpf, hours post fertilization; MHB, midbrain-hindbrain boundary; PM, plasma membrane; THN, tegmental hindbrain nuclei neuron; WISH, whole mount in situ hybridization; YFP, yellow fluorescent protein.