
|
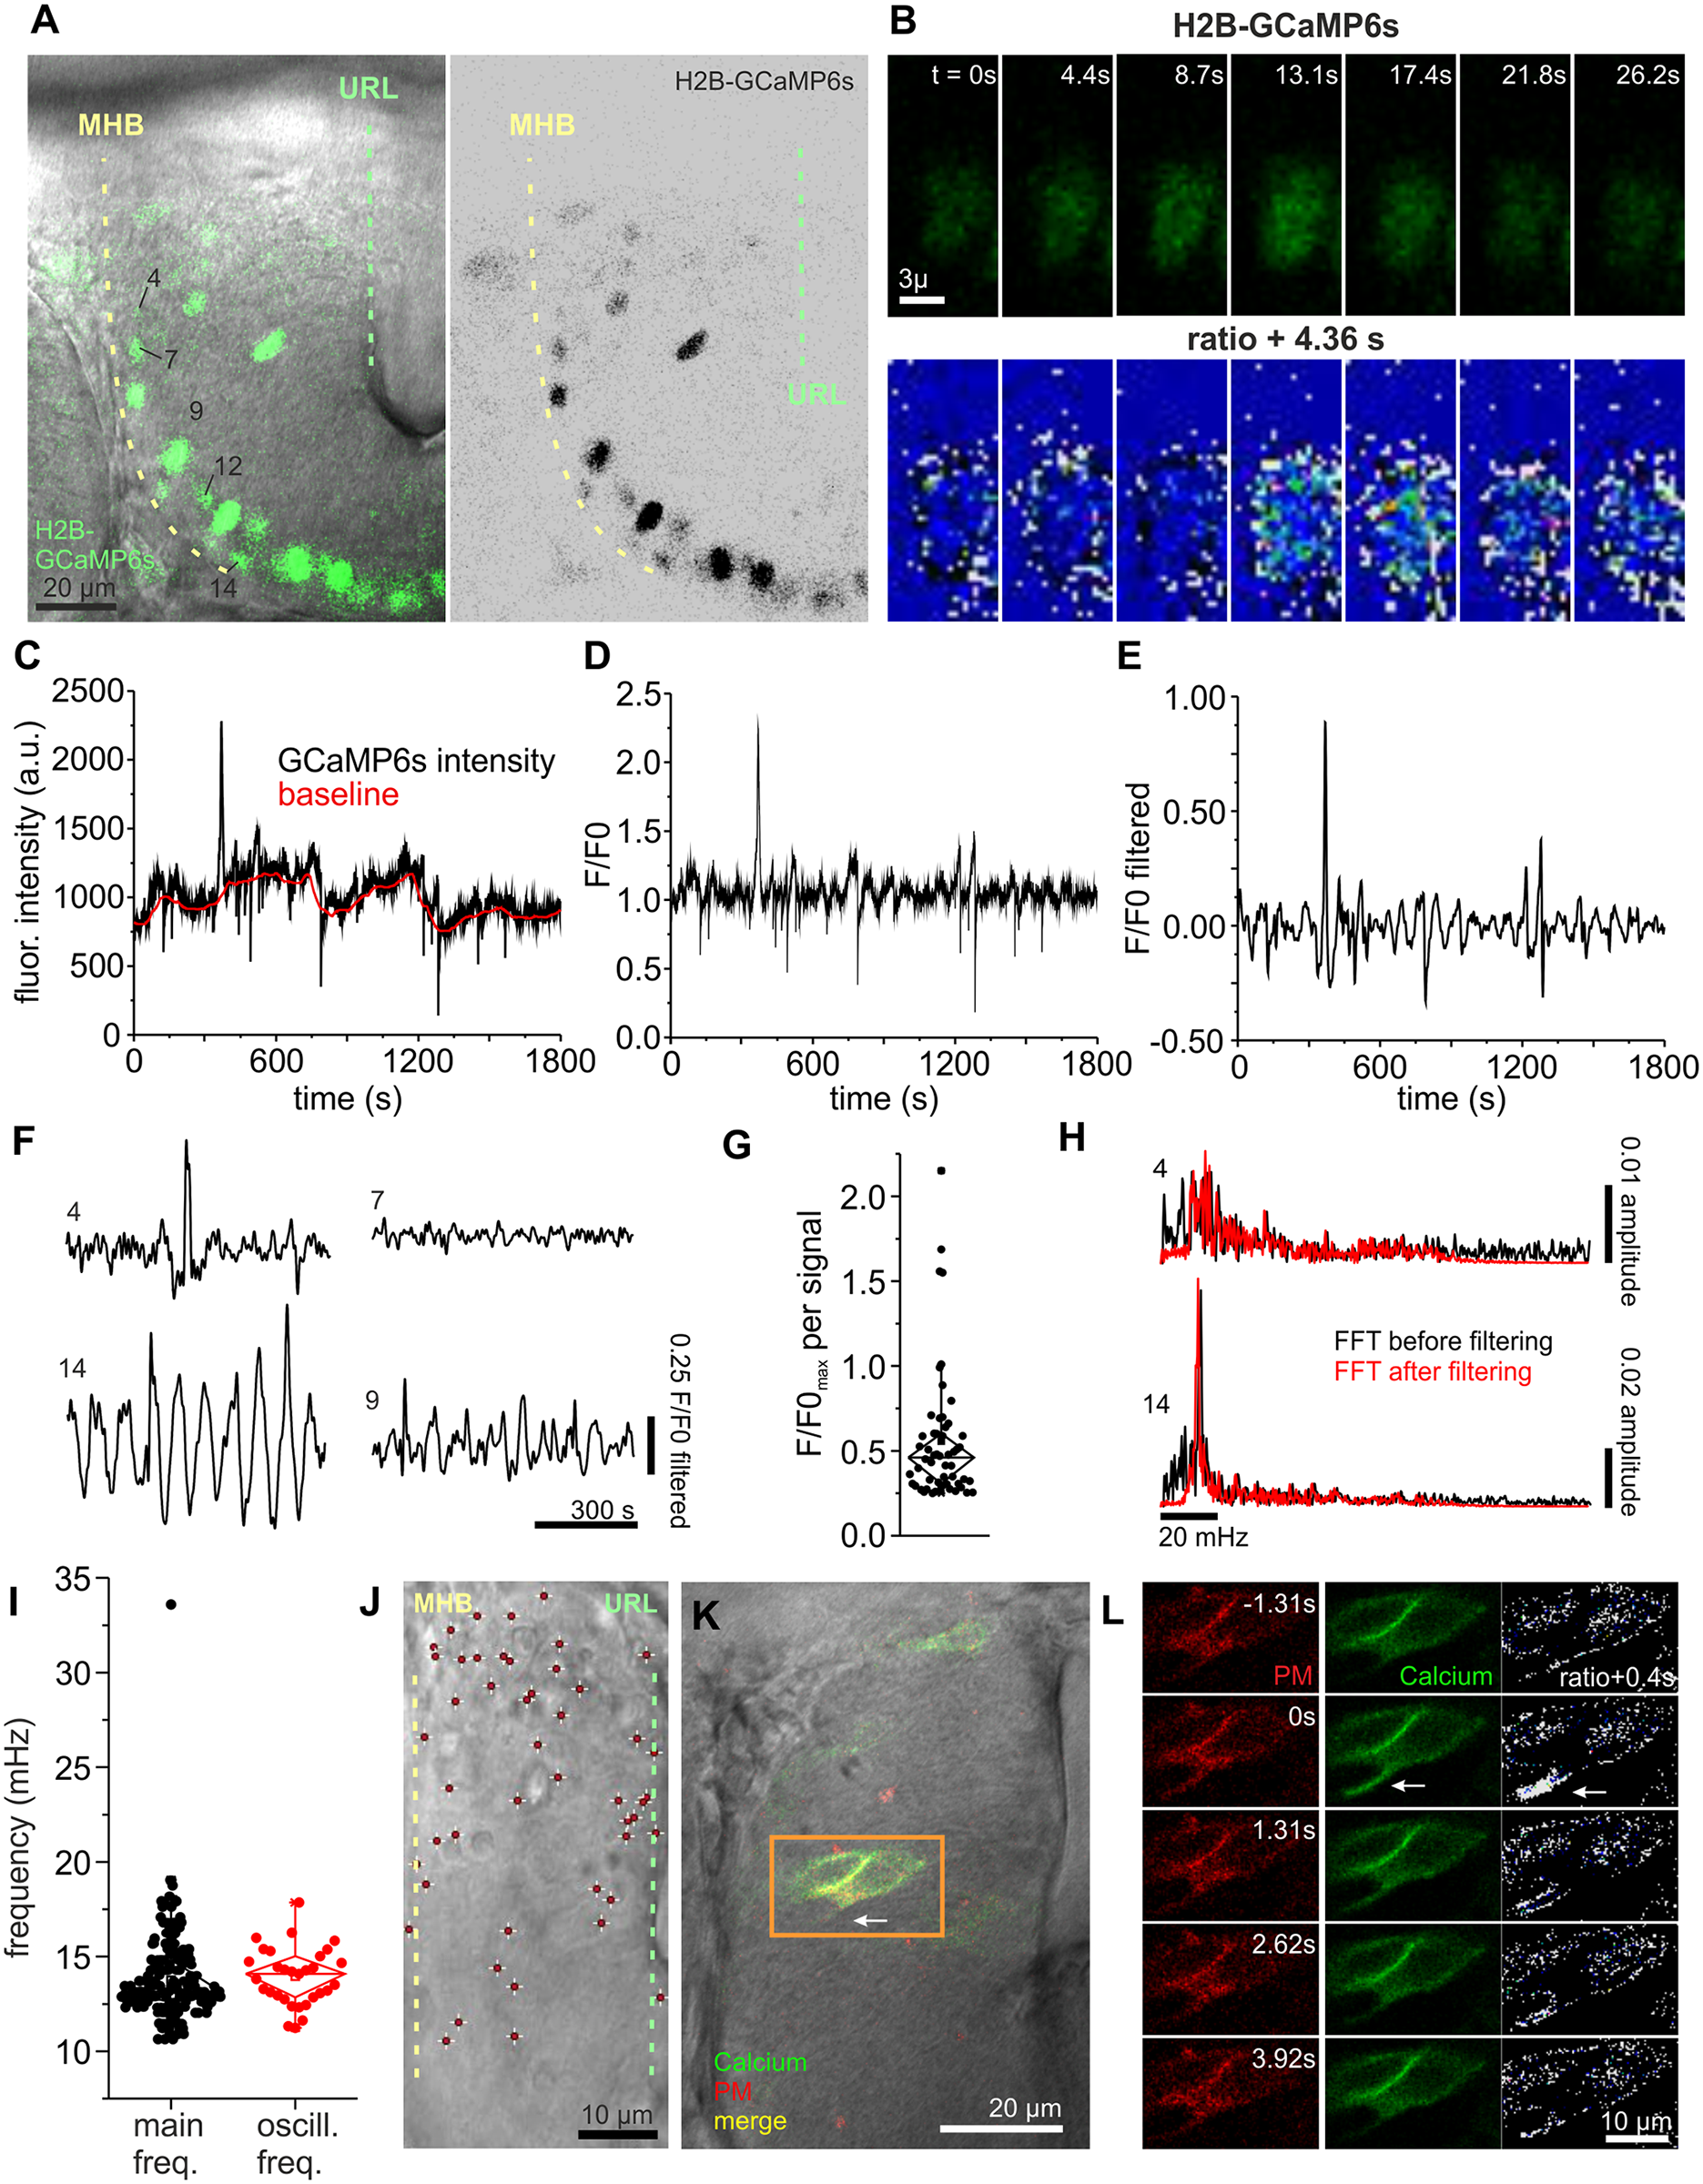
Fig. 2
Calcium signals indicate the presence of activity in the cerebellum.
(A) As THNs differentiate along route, only THNs in phase 2 show expression of H2B-GCaMP6s from the elavl3 promoter, which increases in strength towards the ventral end of the MHB. Numbers identify the nuclei shown as examples in this figure. Scale bar: 20 μm. (B) Stills from the fluorescence recording of nucleus 12 shown in (B), top panel, demonstrate the presence of calcium transients. In the lower panel, a ratiometric image comparing subsequent frames of the sequence in the top panel is given. White indicates high-intensity divergence and blue indicates low-intensity divergence. Scale bar: 3 μm. (C) Fluorescence intensity measurement F of nucleus 12 for the whole observation time is shown in black and the calculated local baseline F0 in red. (D) Converting these into F/F0 shows that nucleus 12 exhibited only one prominent calcium event with smaller amplitudes difficult to judge due to the presence of noise. (E) After application of a bandpass filter, noise and false-positive signals are removed from the trace, whereas actual signals become more prominent. (F) Different patterns of calcium transients are shown for several nuclei imaged simultaneously. Nucleus 4 exhibits a single event like nucleus 12, whereas nucleus 7 is silent during the observation time. Nucleus 14 represents very regular calcium oscillations that were observed in a fraction of nuclei, whereas nucleus 9 appears to be a mixture of several types. (G) Plotting maximal amplitude values for each signal demonstrates that a wide range of signal strengths can be detected in THNs. (H) Fourier transformation analysis of the various traces illustrates that some nuclei have very regular signals at a distinct frequency (bottom), whereas others with a low incidence of calcium events do not show this preference (top). For control, results were compared for filtered (red) and unfiltered (black) traces. (I) All 195 FFTs were analyzed for the most prominent frequency by plotting the frequency corresponding to the maximal amplitude value. Although this represents the range of frequencies contained in the dataset, the frequency of regular oscillations can be obscured by the inclusion of other signal patterns. Hence, 32 nuclei with strong regular calcium oscillations were selected and their oscillation frequency determined by Gaussian fits. The frequencies of these oscillations are centered around a mean value of 14.1 mHz. (J) Calcium signals are detected in THNs throughout the cerebellum. The positions of THNs transiently expressing PM-bound GCaMP6s and exhibiting at least one signal during the observation period of 30 min were superimposed to create a map (N = 50). Scale bar: 10 μm. (K) Example of a THN exhibiting localized calcium signals, showing the position of the cell in the tissue. Scale bar: 20 μm. (L) Stills from the recording of THNs indicated in (K). Ratiometric images comparing the fluorescence of GCaMP6s in subsequent stills relative to the frame with the highest signal are shown (white indicates high, blue low signal difference). Arrow points to the calcium signal. Elapsed time relative to the frame with the highest GCaMP6s signal is indicated on the images. Scale bar: 10 μm. See also S3 Video. Data depicted in the graphs can be accessed in S1 Data. F/F0, fluorescence over background; FFT, fast Fourier transform; flour, fluorescent; freq, frequency; GCaMP6, genetically encoded calcium sensor, circular permutated green florescent protein-Calmodulin-M13 peptide 6; H2B, Histone 2B; MHB, midbrain-hindbrain boundary; oscill, oscillation; PM, plasma membrane; THN, tegmental hindbrain nuclei neuron, URL, upper rhombic lip.