
|
Fig. S5
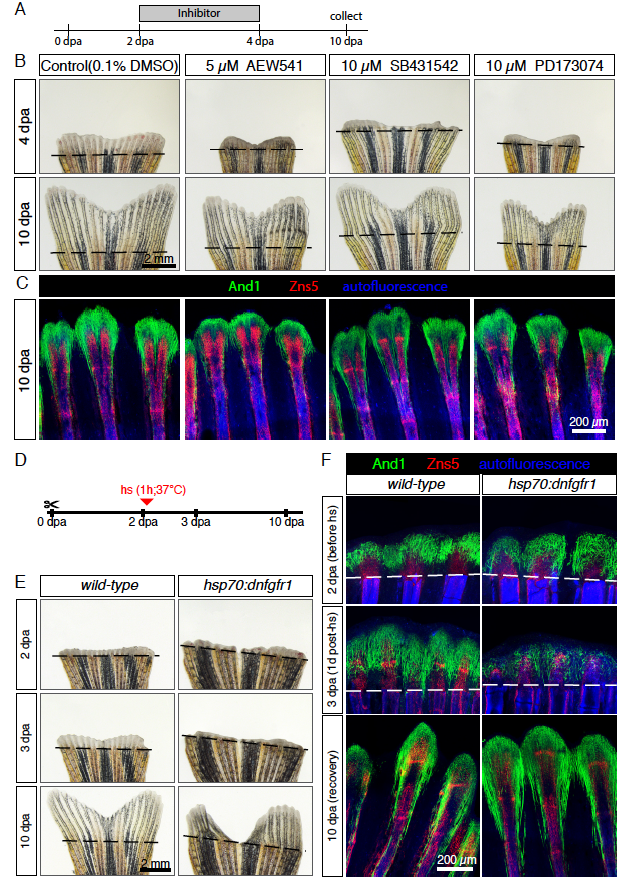
Actinotrichia resume regeneration after a pulse inhibition of signaling pathways.
(A-C) Pulse exposure to the inhibitors of the IGF (AEW541), TGFβ/Activin-βA (SB431542) and FGF (PD173074) signaling pathways. (A) Experimental design. (B) Live-imaging at 4 and 10 dpa. Fins resumed regeneration without major morphological defects after interruption of treatments. N = 4 fish per treatment. (C) Whole-mount immunofluorescent staining for And1 (green) and Zns5 (red) of 10 dpa fins shows recovery of actinotrichia fibers after arrest of treatment. Bone autofluorescence in blue. N = 4 fish per treatment. (D-F) Pulse inhibition of the FGF pathway through heat-shock activation of the dominant negative FGF receptor type 1 (hsp70:dnfgfr1-egfp fish). (D) Experimental design (E) Live-imaging at 2, 3 and 10 dpa shows recovery after pulse inhibition of the FGF pathway. Persistent morphological defects in 2 of 4 transgenic fins. (F) Whole-mount immunofluorescent staining for And1 (green) and Zns5 (red) of 2, 3 and 10 dpa fins. Bone autofluorescence in blue. After heat-shock actinotrichia fibers decreased in the blastema (3 dpa). At 10 dpa, actinotrichia recovered. N ≥ 3 fish per group per time point. hs: heat shock.
Reprinted from Developmental Biology, 433(2), König, D., Page, L., Chassot, B., Jaźwińska, A., Dynamics of actinotrichia regeneration in the adult zebrafish fin, 416-432, Copyright (2017) with permission from Elsevier. Full text @ Dev. Biol.