
|
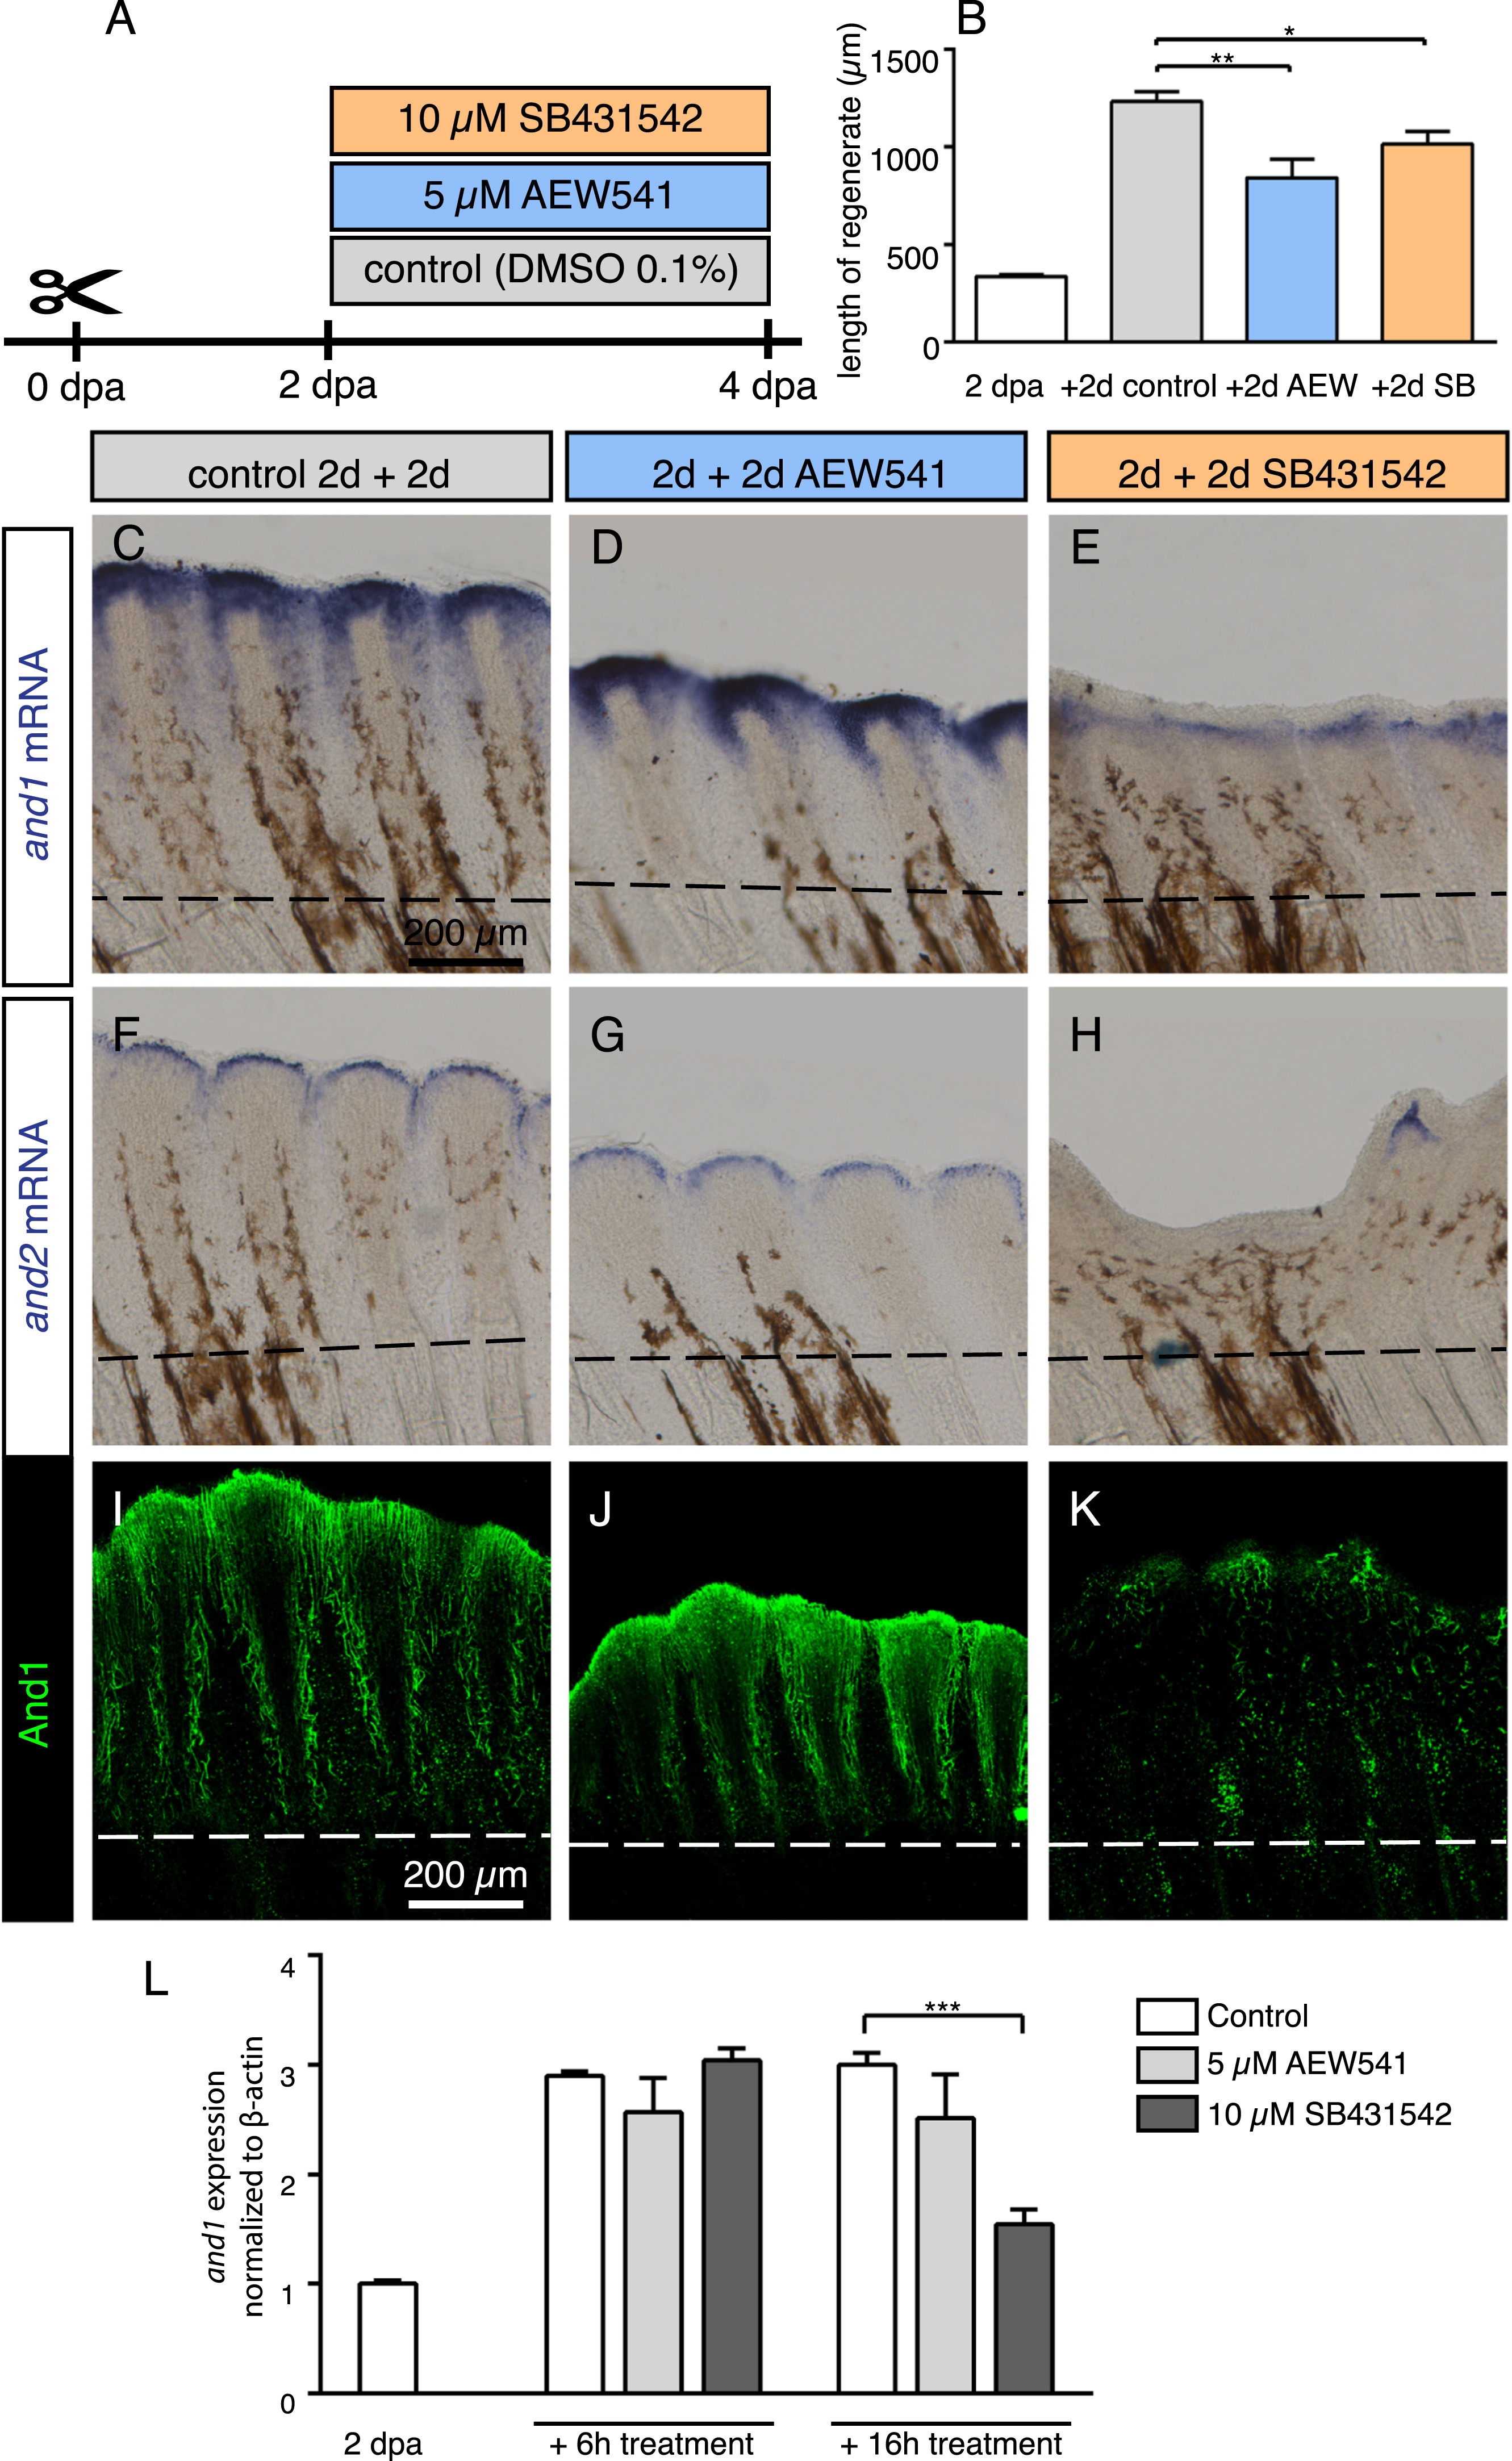
Fig. 7
Modulation of and1 and and2 expression in response to pulse inhibition of TGFβ/Activin-βA and IGF signaling. (A) Experimental design for inhibition of TGFβ/Activin-βA signaling by SB431542 and of IGF signaling by AEW541. (B) Quantification of length of regenerate as the average length of the second, third, and fourth rays from the lateral edge of the fin. N ≥ 4 for each group. Error bar indicates SEM, *P<0.05, ** P<0.01. (C-H) Whole-mount in-situ hybridization for and1 and and2 on 4 dpa fins. Inhibition of TGFβ/Activin-βA (SB431542) blocked expression of both genes, whereas inhibition of IGF (AEW541) had no effect. (I-K) Whole-mount immunofluorescence staining for And1 (green) on 4 dpa fins. TGFβ/Activin-βA inhibition (K) caused a loss of actinotrichia as compared to control (I) and IGF inhibition (J). (L) qRT-PCR analysis of and1 expression after 6 h or 16 h of treatment with the pharmacological inhibitors AEW541 (IGF pathway) and SB431542 (TGFβ/Activin-βA pathway). Treatments started at 2 dpa. The relative expression was normalized to control fins at 2 dpa. N = 3 (9 fins each). Error bars represent SEM, *** P<0.001.
Reprinted from Developmental Biology, 433(2), König, D., Page, L., Chassot, B., Jaźwińska, A., Dynamics of actinotrichia regeneration in the adult zebrafish fin, 416-432, Copyright (2017) with permission from Elsevier. Full text @ Dev. Biol.