
|
Fig. 4
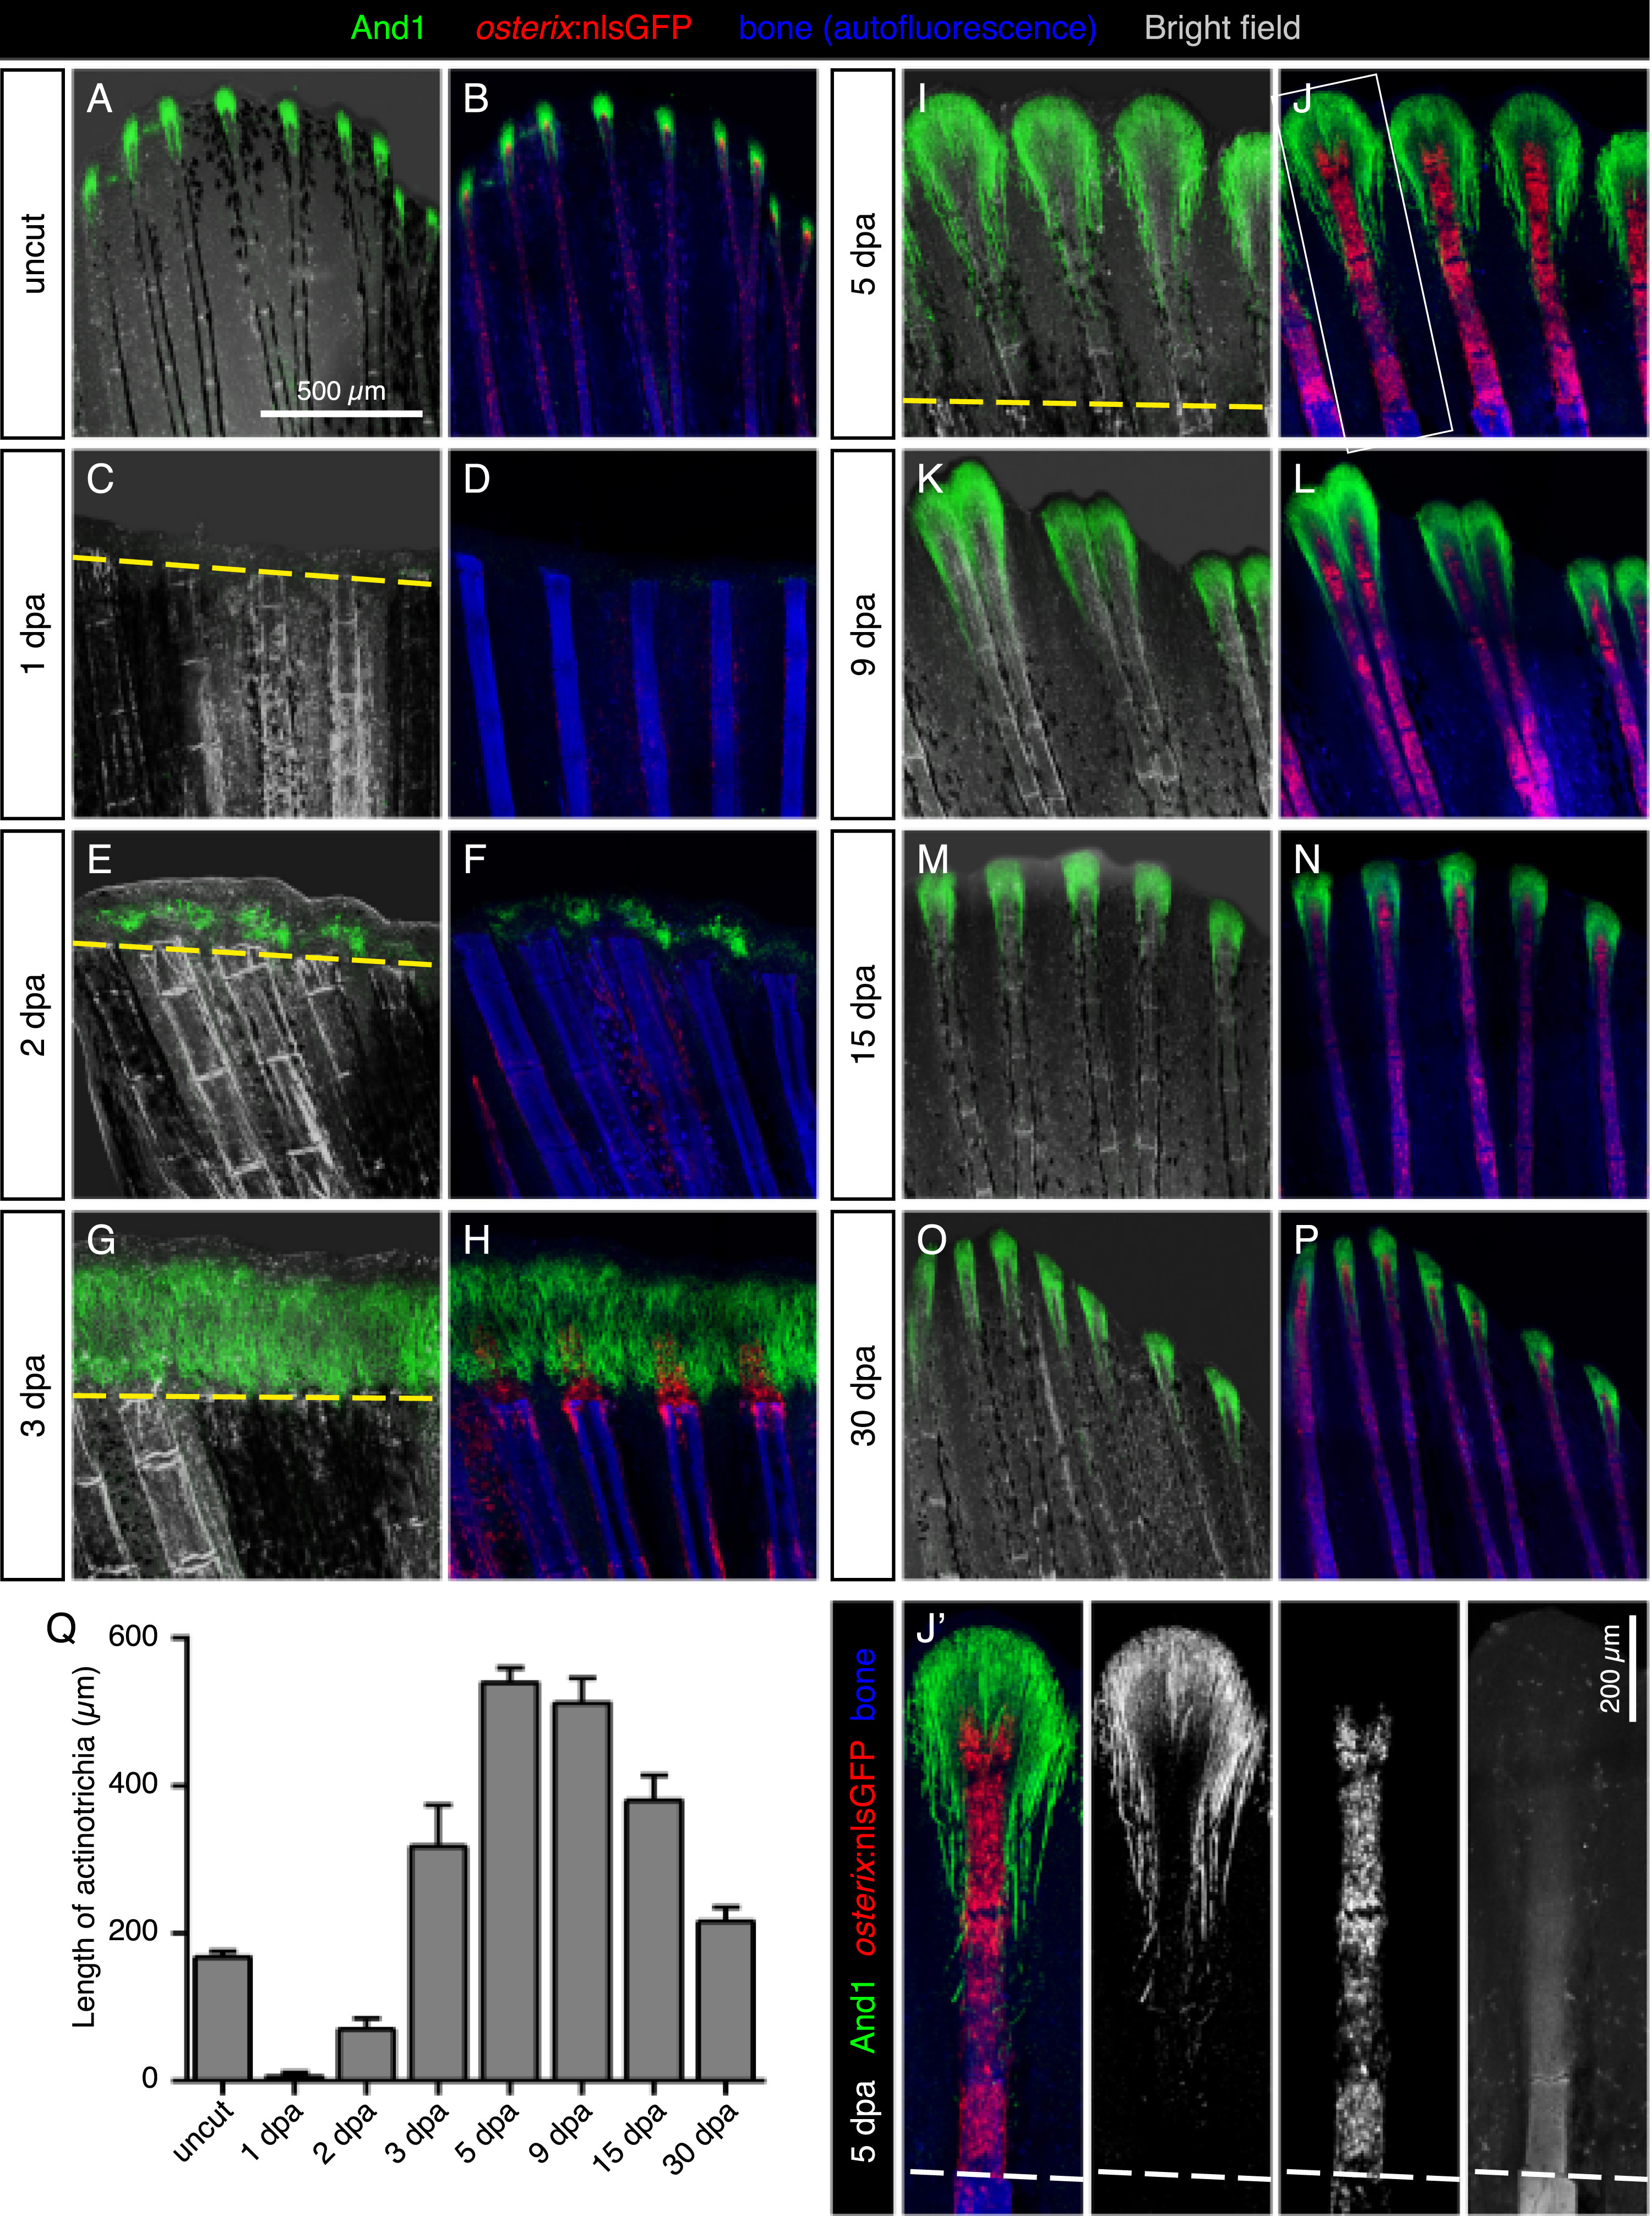
Dynamics of actinotrichia regeneration correlate with lepidotrichia regrowth. (A-P) Immunofluorescence staining for And1 (green) in osterix:nlsGFP fish (osteoblasts; red) at different time points after amputation (dpa). Bone matrix/tissue autofluorescence shown in blue. (Q) Quantification of the length of And1-positive regions at different time points during regeneration. Each fin was represented by the measurements of the second, third, and fourth ray relative to the edge of both lobes. N ≥ 4 fins for each time point. 6 rays per fin. Error bars represent SEM. (J′) Magnification of a single ray at 5 dpa, showing inverse correlation between And1 deposition and osterix:nlsGFP. The V-shaped tip of the regenerating lepidotrichium indicates an initiated ray bifurcation.
Reprinted from Developmental Biology, 433(2), König, D., Page, L., Chassot, B., Jaźwińska, A., Dynamics of actinotrichia regeneration in the adult zebrafish fin, 416-432, Copyright (2017) with permission from Elsevier. Full text @ Dev. Biol.