
|
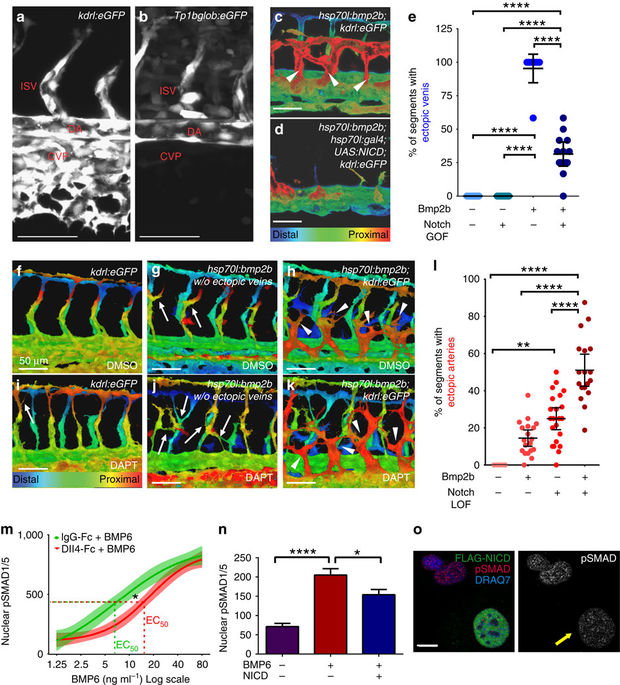
Fig. 2
(a,b) Lateral view of vessel-specific (a) or Notch-activated (b) GFP expression in 28 hpf fish embryos. Scale bar, 50 μm. (c,d) Depth-encoded lateral view of44 hpf fish embryos heat-shocked at 26 hpf. Scale bar, 50 μm. (c) Tg(hsp70l:bmp2b) embryos overexpress Bmp2b; (d) Tg(hsp70l:bmp2b);Tg(UAS:NICD); Tg(hsp70l:gal4) overexpress both Bmp2b and NICD. (e) Quantification of ectopic venous sprouts, representative of two independent experiments. Data points, individual embryos (n=12 WT, 11 Tg(hsp70l:Gal4);Tg(UAS:NICD), 9 Tg(hsp70l:bmp2b), 13 compound transgenics). Error bars, mean±95% CI. ****P≤0.0001 by one-way analysis of variance (ANOVA), with Tukey’s post-hoc test. (f–k) Depth-encoded compressed z-stack lateral views of 44 hpf embryos heat shocked at 26 hpf and treated with vehicle (f–h) or DAPT (i–k) from 10 hpf, representative of three independent experiments. (f,i) WT embryos; (g,j) Tg(hsp70l:bmp2b) embryos with ectopic venous z-slices removed to visualize intersegmental arteries; (h,k) Tg(hsp70l:bmp2b) embryos. (l) quantification of ectopic arterial sprouts. Data points, individual embryos (n=27 WT/dimethyl sulfoxide (DMSO), 26 Bmp2b/DMSO, 23 WT/DAPT and 26 Bmp2b/DAPT). Error bars, mean±95% CI. *P≤0.05, **P≤0.01 and ****P≤0.0001 by Kruskal–Wallis with Dunn’s post-hoc test. DA, dorsal aorta; DV, dorsal vein; ISV, intersegmental vessel; VV, ventral vein. (m) BMP6 twofold dose–response curve (indicated on x axis) in HUVEC after Notch activation (Dll4-Fc, red line) versus control (IgG-Fc, green line), representative of two independent experiments. Data are four-parameter best-fit curves (solid lines) ±95% confidence bands (filled areas). *P≤0.05 by nonlinear regression. Quantification (n) and panels (o) of nuclear pSMAD1/5 expression in individual HUVEC with indicated conditions, representative of two independent experiments. Yellow arrow, EC expressing FLAG-NICD. Scale bar, 10 μm. Error bars, mean±s.e.m. *P≤0.05 and ****P=0.0001 by one-way ANOVA with Tukey’s post-hoc test.