
|
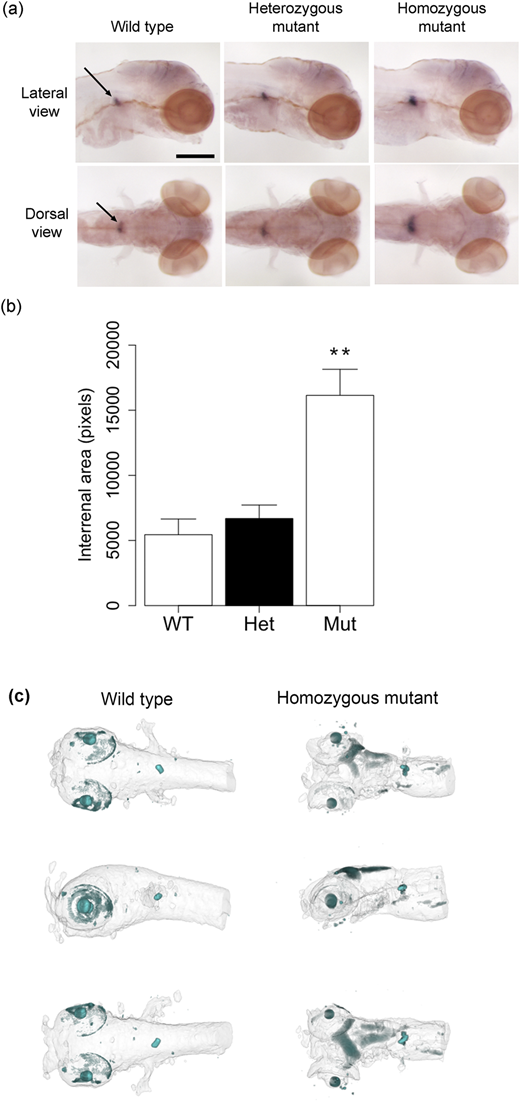
Fig. 2
Zebrafish cyp21a2 mutants have enlarged interrenal tissue at 120 hpf. (a) Expression of cyp17a2 in 120-hpf cyp21a2uob2122 wild-type, heterozygous, and homozygous cyp21a2uob2122 mutant larvae in lateral (upper panel) and dorsal (lower panel) views. The area of cyp17a2-positive interrenal tissue (arrows) is enlarged in homozygous mutants. n = 6 each. Scale bar: 0.25 mm. (b) Quantification of the area of cyp17a2-positive interrenal tissue in 120-hpf cyp21a2uob2122 larvae. The interrenal tissue is significantly larger in homozygous mutants (Mut) than in wild-type (WT) and heterozygous (Het) siblings (ANOVA: F = 12.15, df = 2,15, P = 0.0007; Tukey: WT vs. Het P = 0.895, WT vs. Mut P = 0.003, Het vs. Mut P = 0.003). **P < 0.01 compared with wild types and heterozygotes. n = 4 to 8 each. (c) OPT imaging of 120-hpf cyp21a2 larvae after WISH for cyp17a2 reveals an enlarged interrenal gland in cyp21a2uob2122 homozygous mutants (right) compared with wild-type siblings (left). Whole-mount ventral (upper), lateral (middle), and dorsal (lower) views are shown.