
|
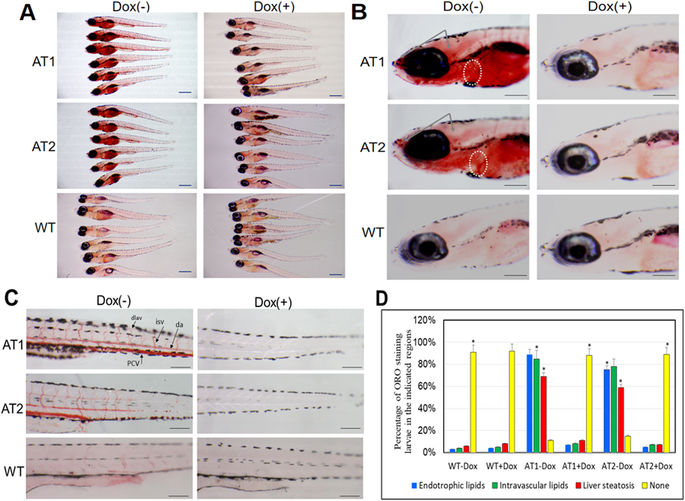
Fig. 2
Induction of endotrophic and intravascular lipid accumulation in larval ATs. (A) Whole-mount ORO staining of 9-days post fertilization (dpf) ATs ± Dox and WT ± Dox larvae (32X magnification, scale bars: 200 μm). (B) Enlargement at the brain region in (A) shown lipid accumulation in brain and heart. ORO stained brain regions are indicated by the arrows. Hearts are circled (110X magnification, scale bars: 200 μm). (C) Enlargement at the posterior level in (A) shown intravascular lipid accumulation (110X magnification, scale bars: 200 μm). (D) Cumulative percentage of ORO staining zebrafish larvae in the indicated regions. Statistical analyses of ATs ± Dox and WT ± Dox larvae with liver steatosis and intravascular lipids was calculated through ORO staining at 9 dpf. The ORO staining were performed in triplicate with on average 60–80 larvae per groups (WT-Dox, WT + Dox, AT1-Dox, AT1 + Dox, AT2-Dox, and AT1 + Dox). The asterisk represents statistically significant differences; *p < 0.01, and **p < 0.005. Abbreviations: da, dorsal aorta; dlav, dorsal longitudinal anastomotic vessel; isv, intersegmental vessel; pcv, posterior cardinal vein.