
|
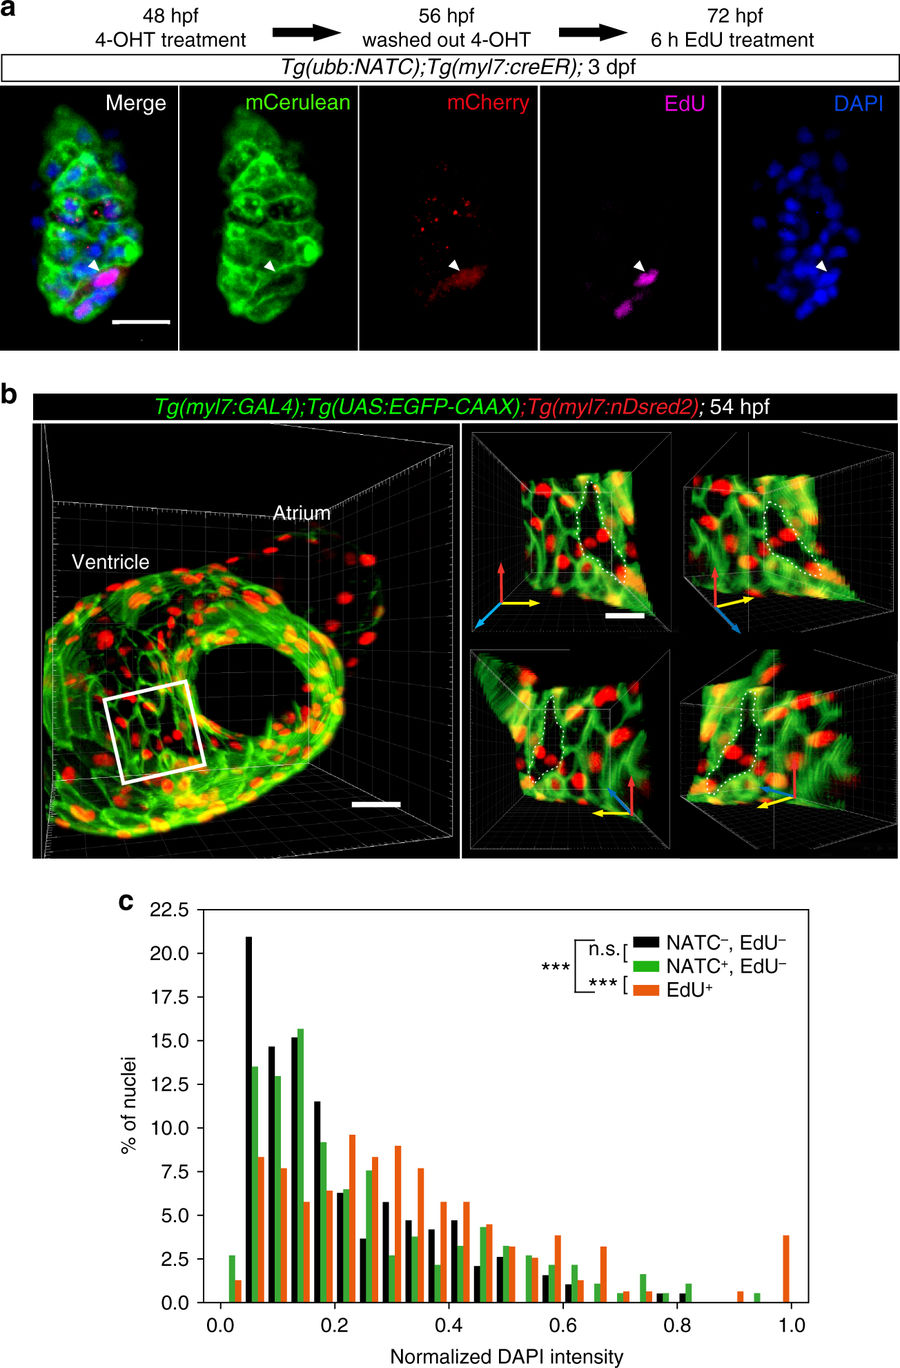
Fig. 8
Membrane fusion does not generate multinuclear or polyploid cardiomyocytes. a Mononucleated NATC-activated cardiomyocytes undergo mitosis. Tg(ubb:NATC);Tg(myl7:creER) embryos were treated with 4-OHT from 48 to 56 hpf. At 72 hpf, the larvae were given a 6 h EdU pulse. Membrane Cerulean (green) and cytoplasmic mCherry (red) expression were visualized by immunostaining. EdU (magenta) and DAPI (blue) staining shows a single nucleus in the EdU + mCherry+ cardiomyocyte (arrowhead). 7.2 μm thick confocal stacks are shown as maximum intensity projections. b Binucleation is rarely observed in embryonic cardiomyocytes. Images are 3D volume renderings of a 54 hpf heart. Cardiomyocyte membrane and nuclei were visualized by Tg(myl7:GAL4);Tg(UAS:EGFP-CAAX) (green) and Tg(myl7:nDsRed2) (red) expression, respectively. Y axis rotation of the ventricular area (small panels on the right), indicated by the white box shows the single-layered compact myocardium with a binuclear cardiomyocyte, outlined with white dashed lines. c Among the EdU− populations, the distributions of DAPI intensity in NTR-mCherry+ cardiomyocytes (green bars) and NTR-mCherry− cardiac cells (black bars) were similar, indicating that DNA content in fused cardiomyocytes is not different from that of non-fused cardiac cells. On the contrary, and as expected, DNA content in EdU+ cells (red bars) was significantly higher than that in EdU− cells (either NTR-mCherry+ or NTR-mCherry−). Tg(ubb:NATC);Tg(myl7:creER) embryos were treated with 4-OHT from 24 to 40 hpf. NTR-mCherry expression and proliferating cells were labeled by immunostaining at 7 dpf after a 16 h EdU pulse. DAPI intensity measurements were performed on 3D volume-renderings obtained from confocal images. n = 311 NTR-mCherry−EdU− cells, n = 227 NTR-mCherry+EdU− cells, n = 173 EdU+ cells, from 5 larvae. ***p < 0.001, n.s., not significant, two-sample Kolmogorov–Smirnov test. Representative images from 11 larvae (a) and 10 embryos (b) are shown as average intensity projections (a) and 3D surface renderings (b) of 12 (a) and 60 (b) μm thick confocal stacks. Scale bars: 20 μm (a, b small panels), 30 μm (b, large panel on the left)