
|
Fig. 6
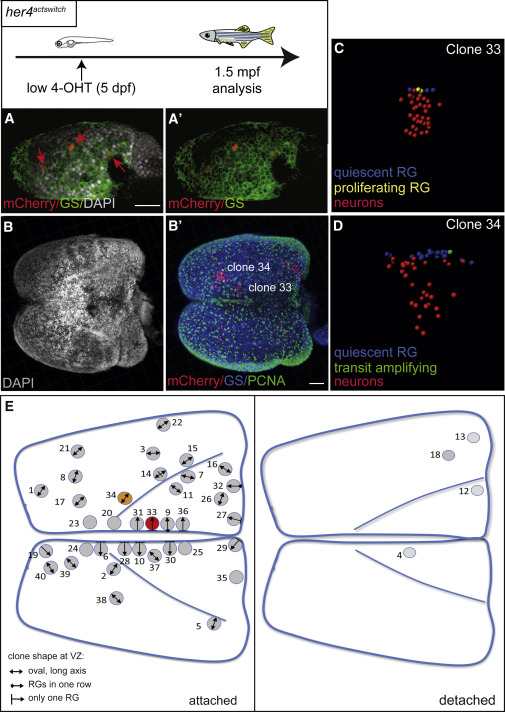
Clonal Analysis with Cell-Type Identification Confirms Long-Lasting Neurogenesis from Individual Pallial RGs
Top: experimental scheme.
(A and A′) Whole-mount dorsal view (anterior left) of a typical 6-dpf pallial hemisphere from a her4actswitch,4OHT(5dpf) fish stained at 1 day post-treatment for mCherry and GS (counterstained with DAPI). Red arrows point to individual recombined RGs.
(B and B′) Whole-mount dorsal view (anterior left) of a typical 1.5-mpf pallium from a her4actswitch,4OHT(5dpf) fish stained for mCherry, GS, and PCNA (B′).
(C and D) Segmented image of clone 33 (C) and clone 34 (D) highlighted in (B′) (color coded for cell types).
(E) Position of the 40 clones in flattened dorsal views of the 1.5-mpf pallium (clones 33 and 34 in B and B′ are colored). The shape of the VZ component of each clone is indicated (code bottom left).
See also Figure S5 and Table S3. Scale bars, 100 μm.