
|
Fig. 3
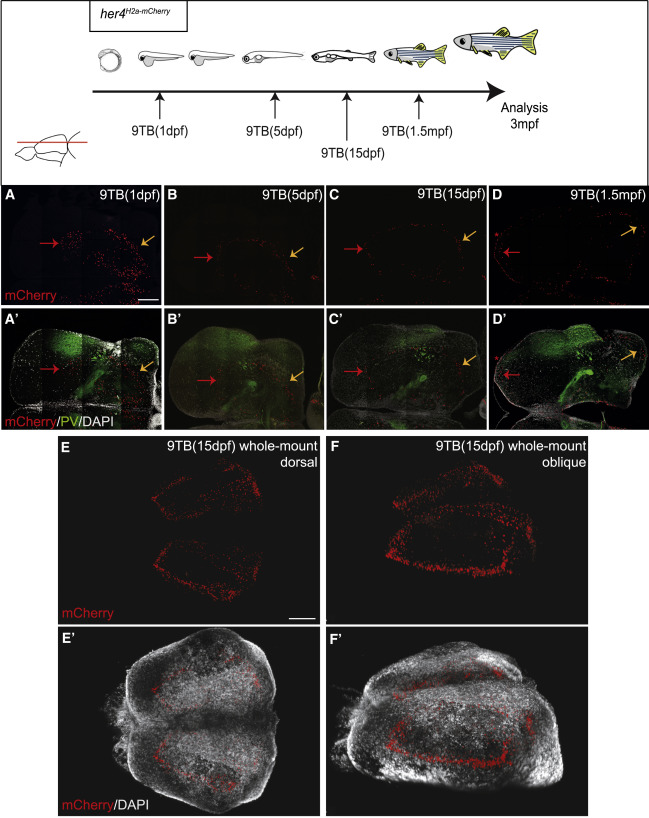
Zebrafish Pallial Neurogenesis Follows a Sequential Stacking Process: Antero-posterior Analysis
Top: experimental design.
(A–D′) Horizontal sections are shown and the level is indicated by a red line on telencephalon lateral view; same stainings as in Figures 2Figures 2A–2F′. Red and orange arrows indicate anterior and posterior limits of the mCherry-positive neuronal layers, respectively. Red asterisks in (D) and (D′) indicate RGs maintaining the mCherry label.
(E–F′) Transparent whole-mount preparation of a her4H2a-mCherry,9TB(15dpf) pallium at 3 mpf. The pallium is observed from different angles (E: dorsal anterior left; F: lateral oblique).
Scale bars, 100 μm.