
Image
|
Figure Caption
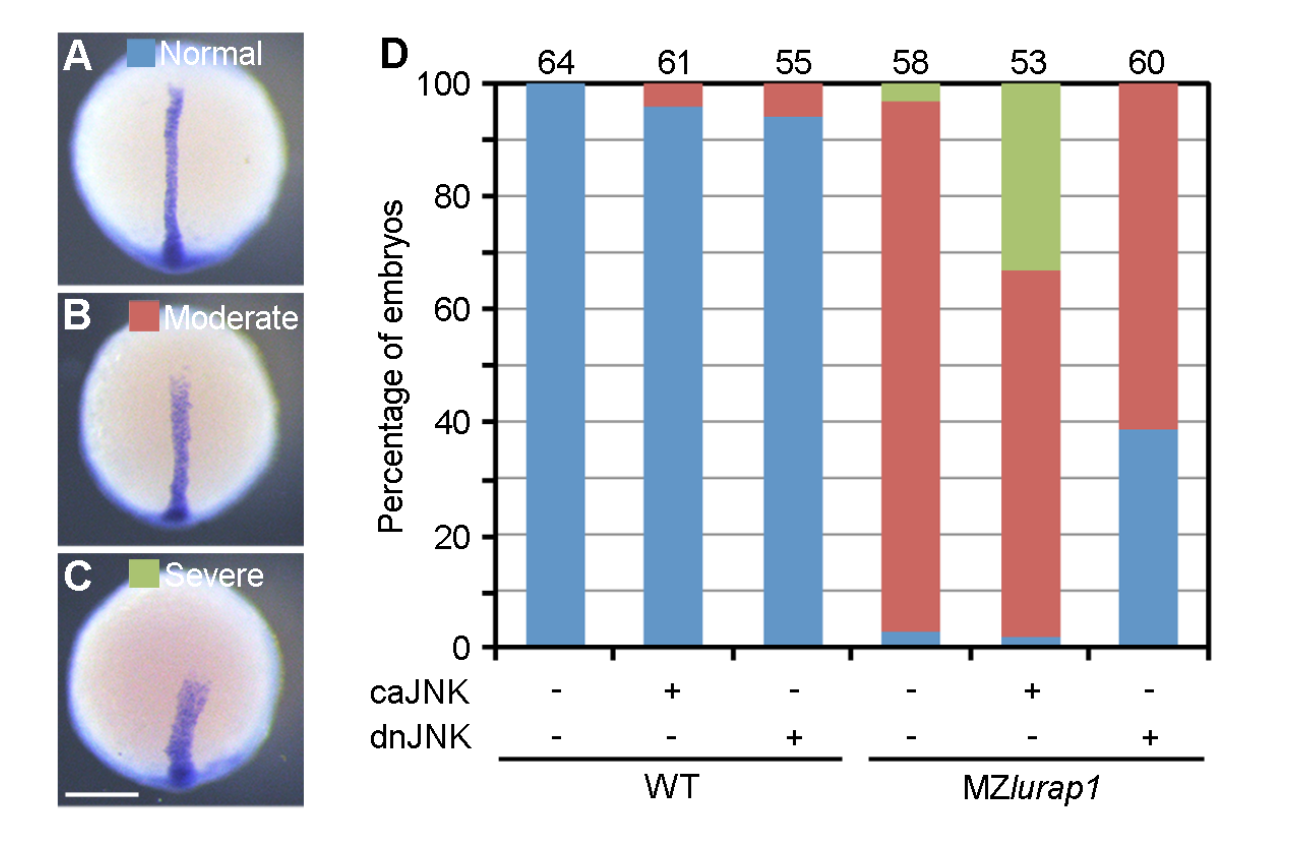
Fig. s11
Functional interaction between Lurap1 and JNK signalling in CE movements. (A-C) Analysis of ntla expression pattern to assess the extent of CE defects. All embryos were analysed at the bud stage and classified into three groups, as indicated. (D) The defective CE phenotypes in MZlurap1 embryos are enhanced by caJNK, and rescued by dnJNK. The data were obtained from three experiments, with total number of embryos shown on the top of each stacked column. Scale bar: (A-C) 200 μm.
Acknowledgments
This image is the copyrighted work of the attributed author or publisher, and
ZFIN has permission only to display this image to its users.
Additional permissions should be obtained from the applicable author or publisher of the image.
Full text @ Nat. Commun.