
|
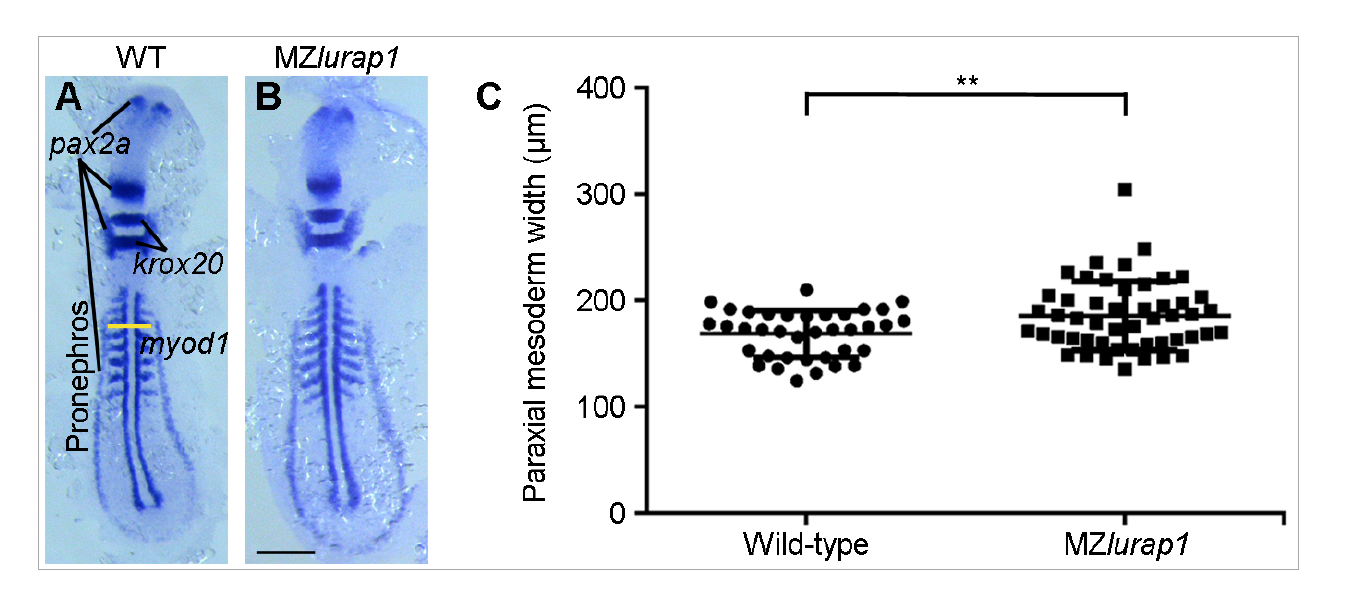
Fig. s4 The defective CE phenotypes in MZlurap1 mutants are not caused by a developmental delay. (A,B) Simultaneous in situ hybridisation analysis of pax2a, krox20, and myod1 expression patterns in flat-mounted WT and MZlurap1 embryos with equal somite number. The yellow horizontal line defines the inner sides of the pronephric anlages, and reflects the width of the paraxial mesoderm. (C) Scatter plot shows that MZlurap1 embryos display wider paraxial mesoderm. The paraxial mesoderm width was defined as the distance between the inner sides of the pronephric anlage at the third somite level. Bars represent the mean values ± s.d. from two independent experiments (**, P<0.01; Student’s t-test). Scale bar: (A,B) 200 μm.