
|
Fig. S14
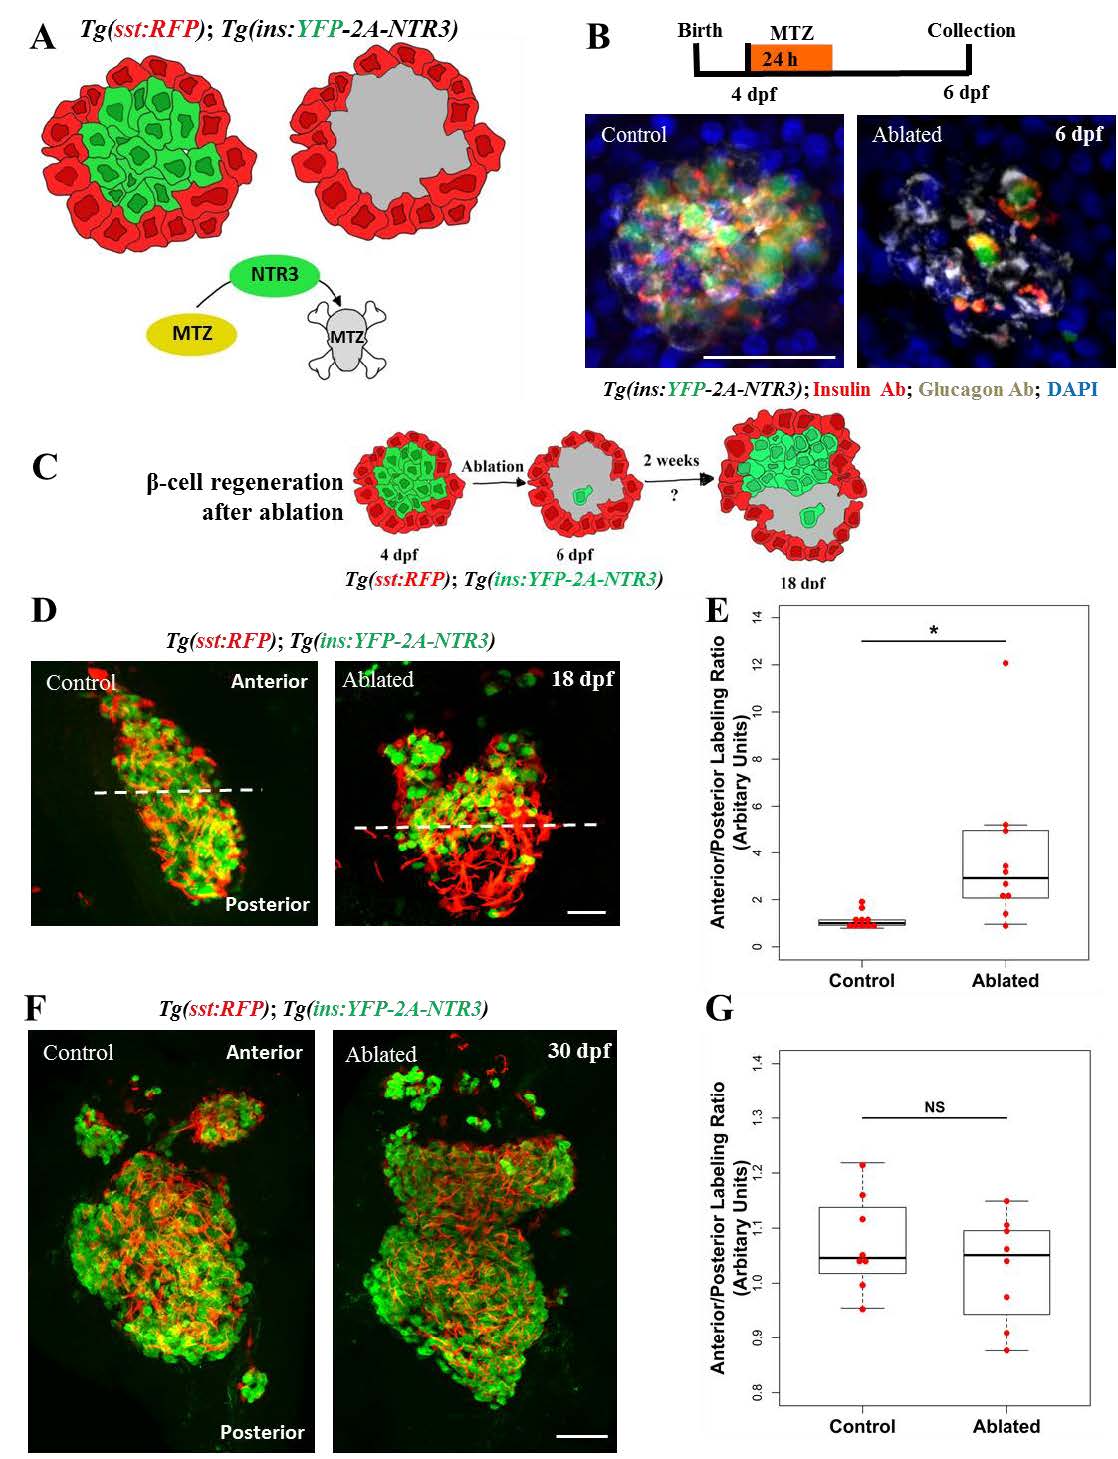
Regeneration of beta-cells is asymmetric along the anterior-posterior axis of the primary islet. (A) Cartoon depicting the experimental setup for conditional ablation of beta-cells. Tg(ins:YFP-2A-NTR3) drives beta-cell specific expression of a triple-mutant version of the Nitroreductase (NTR) enzyme, which converts the substrate metronidazole (Mtz) into a cytotoxic substance with higher efficiency compared to wild-type NTR. Mtz-treatment kills specifically the NTR-expressing beta-cells without harming their neighbors. Tg(sst:RFP)-expression in delta-cells is used to outline the perimeter of the islet (red). (B) Top - schematic for testing the efficiency of beta-cell ablation upon Mtz-treatment. Animals were incubated in 10 mM Mtz (or vehicle) at 4 dpf for 24h and their pancreata were analyzed 48h later (6 dpf). Bottom - maximum intensity projections of the pancreata of control and Mtz-treated (ablated) Tg(ins:YFP-2A-NTR3) animals stained with anti-insulin and anti-glucagon antibodies. DAPI labels cell nuclei. The MTZ-treated animals showed marked loss of beta-cells, while glucagon-expressing alpha-cells were spared from the ablation. (C) Cartoon depicting the experimental setup for evaluating the pattern of beta-cell regeneration following the near-complete ablation of the embryonic beta-cells. Beta-cells (green) were ablated using Tg(ins:YFP-NTR3). Tg(sst:RFP)-expression in delta-cells helps outline the islet’s perimeter (red). Following ablation at 4 dpf, the pattern of regeneration is assessed at 18 dpf. (D) Maximum intensity projections of islets oriented along the anterior-posterior (A/P) axis from control and beta-cell-ablated Tg(ins:YFP-NTR3);Tg(sst:RFP) animals at 18 dpf (14 days post-ablation). The control islets exhibited uniform beta-cell mass, while in the regenerating islets, a majority of beta-cells were confined to the anterior region. The filamentous appearance of RFP-fluorescence is a result of fixation artifacts that are commonly observed with RFP in this transgenic line. (E) Quantification of the localization of YFP+ beta-cells within the anterior and posterior halves of the control and regenerating islets. The plot shows tukey style boxplot overlaid with the data points. The ratio of intensity of YFP-fluorescence in the anterior versus the posterior half is used as a proxy to estimate the abundance of beta-cells in each half. A ratio of one suggests similar beta-cell occupancy within the two halves, while a greater number indicates more cells in the anterior region. The un-ablated islets exhibited nearly equal beta-cell distribution in the two halves, whereas the regenerating islets showed more beta-cells in the anterior half (t-test, * p ≤ 0.05). (F) The control and ablated animals were allowed to recover for 26 days (30 dpf). Maximum intensity projections of control and Mtz-treated Tg(ins:YFP-NTR3);Tg(sst:RFP) animals. DAPI labels cell nuclei. The ablated islets exhibited uniform localization of beta-cells throughout the islet. (G) Quantification of beta-cell abundance within the anterior and posterior halves of the primary islet for the controls and the ablated animals at 30 dpf. The plot shows tukey style boxplot overlaid with the data points. 8 islets were analyzed in each case. No significant differences (t-test, NS p> 0.05) were found between the two halves, suggesting uniform regeneration of beta-cells throughout the islet. Scale bars, 50 μm.