
|
Fig. 4
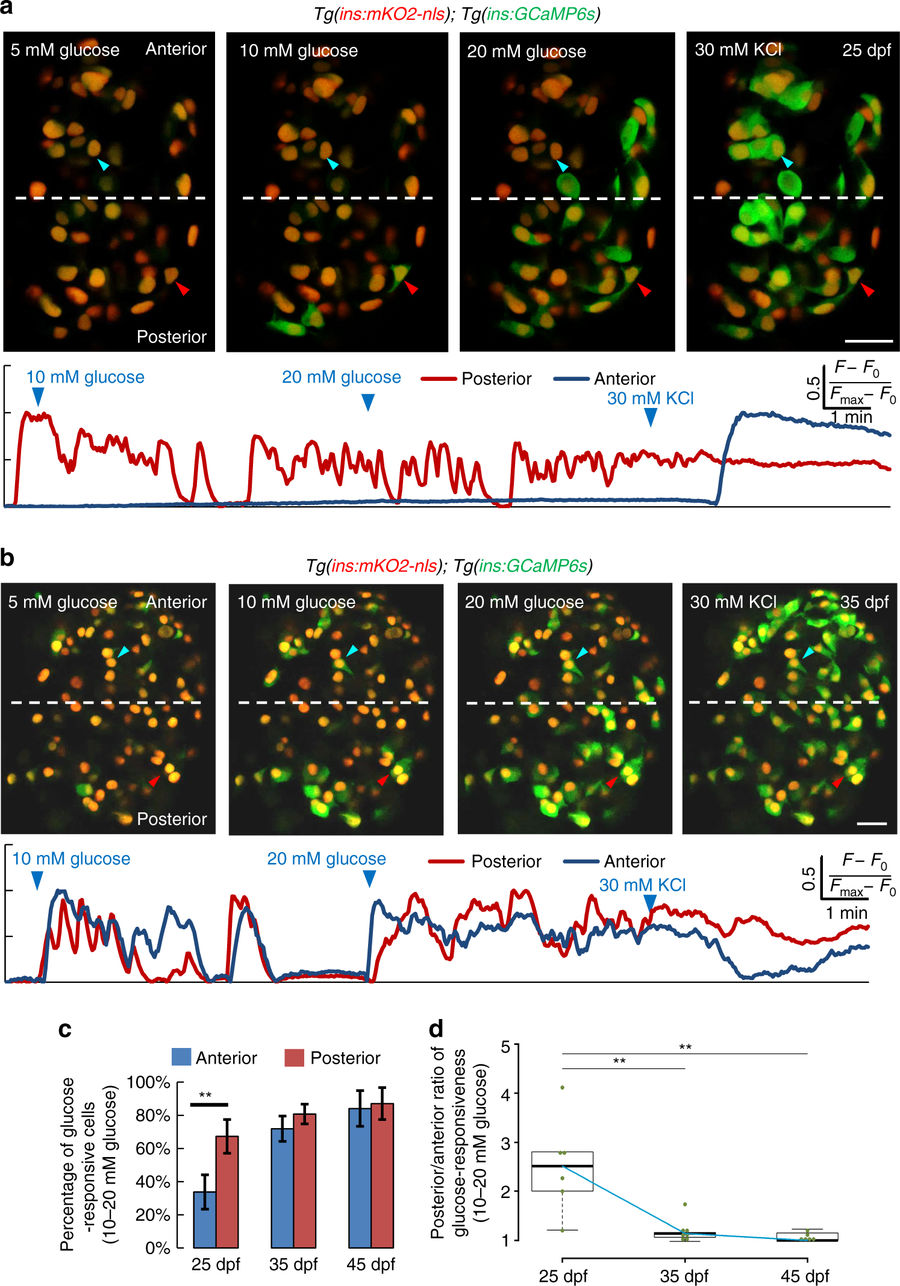
The islet’s anterior and posterior cells exhibit temporal differences in glucose-responsiveness during post-embryonic development. a Top—ex vivo live imaging of islets from 25 dpf Tg(ins:GCaMP6s);Tg(ins:mKO2-nls) animals. Beta-cells (red nuclei) were stimulated with a glucose ramp consisting of sequential incubation with 5 (basal), 10, and 20 mM d-glucose, and depolarized via addition of 30 mM KCl. A beta-cell in the islet’s posterior regions (red arrowhead) exhibits increasing GCaMP6s-fluorescence in response to glucose. The anterior cell (blue arrowhead) only responds after KCl addition. More beta-cells in the posterior region respond to glucose, as compared to the anterior. Bottom—trace of normalized GCaMP6s-fluorescence intensity over time for each of the two cells indicated in the top panels (posterior cell—red trace; anterior cell—blue trace). b Top—ex vivo imaging of islets at 35 dpf as in a. Beta-cells in the islet’s anterior (blue arrowhead) and posterior regions (red arrowhead) exhibit increasing GCaMP6s fluorescence in response to glucose. Bottom—trace of normalized GCaMP6s fluorescence intensity for each of the two cells indicated in the top panels (posterior cell—red trace; anterior cell—blue trace). c Quantification showing the mean percentage of beta-cells that respond upon sequential stimulation with 10 and 20 mM glucose in the islet’s anterior and posterior halves. At 25 dpf, more beta-cells respond to glucose in the posterior half, as compared to the anterior (paired two-tailed t-test, **p ≤ 0.01). At 35 and 45 dpf, both halves show similar percentage of glucose-responsive cells (n 25 dpf = 90 cells in the anterior and 121 cells in the posterior region from 6 islets; n 35 dpf = 133 cells in the anterior and 162 cells in posterior region from 7 islets; n 45 dpf = 159 cells in the anterior and 233 cells in posterior region from 6 islets). Error bars = S.E.M. d Tukey style boxplot showing the posterior/anterior ratio of glucose responsiveness at 25, 35, and 45 dpf. Blue line connects the medians at each stage. The differences in glucose responsiveness between the islet’s anterior and posterior regions diminish with increasing age, as the ratio is close to one at 45 dpf. (Kruskal–Wallis test, p-value = 0.0039; Wilcox test, **p ≤ 0.01). Scale bars, 20 µm