
|
Fig. 1
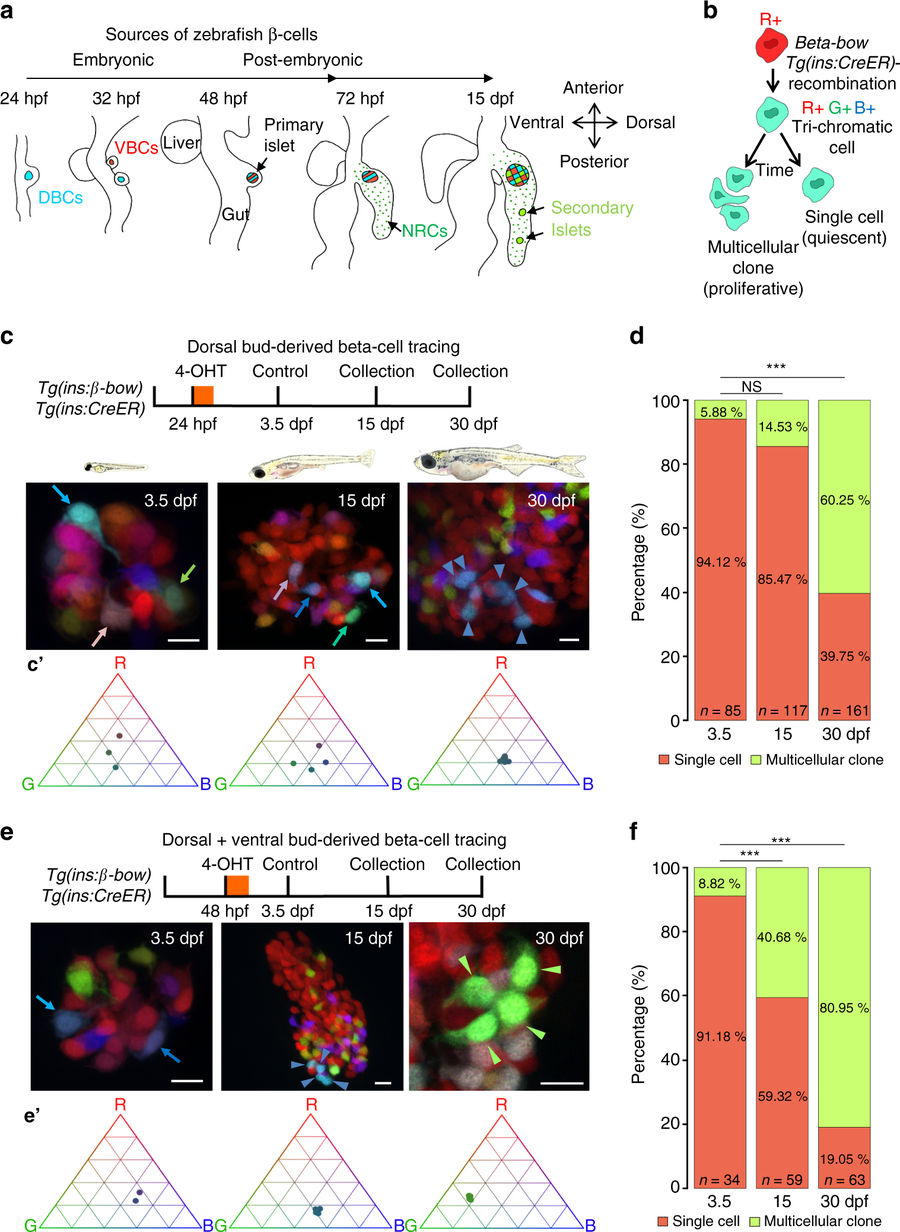
The embryonic islet contains both proliferative and long-term quiescent beta-cells. a Cartoon depicting the multi-lineage composition of the zebrafish primary islet. Embryonic dorsal bud-derived beta-cells (DBCs) and ventral bud-derived beta-cells (VBCs) form the embryonic primary islet. Notch-responsive cells (NRCs) are post-embryonic progenitors that make secondary islets and could contribute beta-cells to the primary islet at later stages. b Clonal analysis schematic. Tg(ins:Cre-ER T2 )-recombination in beta-bow results in combinatorial expression of fluorescent proteins in beta-cells and unique trichromatic bar coding. Trichromatic cells can divide, forming multicellular clones or remain as single cells, indicating quiescence. c Top—DBCs were labeled in multiple colors at 24 hpf (4-OHT treatment for 6 h), and analyzed at 3.5, 15, and 30 dpf. Bottom—primary islets at each stage. Arrows—trichromatic beta-cells remaining as single cells; arrowheads—trichromatic cells forming multicellular clones. See also Supplementary Fig. 7 for wider views with separate channels at 30 dpf. Cartoons (top) show relative animal growth at each stage (to scale). c′ Ternary plots provide visual representation of R, G, B-values for trichromatic beta-cells. Individual single cells have distinct color profiles; multicellular clones are composed of groups of cells with similar profiles. d Quantification showing the percentage of trichromatic cells that remain as single cells or form multicellular clones over the total number of tracked trichromatic events (n). At 3.5 and 15 dpf, a majority of beta-cells remain as single cells, indicating quiescence among DBCs. At 30 dpf, 60% of the beta-cells form multicellular clones (Fisher’s exact test, NS: p > 0.05; ***p ≤ 0.001). e Top—the combined population of dorsal and ventral bud-derived beta-cells (D + VBCs) were labeled at 48 hpf (4-OHT treatment for 3 h) and analyzed at 3.5, 15, and 30 dpf. Bottom—primary islets at each stage. Arrows—trichromatic beta-cells remaining as single cells; arrowheads—trichromatic beta-cells forming multicellular clones. See also Supplementary Fig. 7 for wider views at 30 dpf. e′ Ternary plots showing the R, G, B-values for single cells and multicellular clones. f The proportion of multicellular clones increases significantly at both 15 and 30 dpf compared to 3.5 dpf (Fisher’s exact test, NS: p > 0.05; *** p ≤ 0.001), suggesting that proliferative beta-cells are present within the D + VBC population throughout development. Abbreviations: dpf days post-fertilization, hpf hours post-fertilization, 4-OHT 4-hydroxytamoxifen. d, f represent more than 50 recombined islets/stage from several repeats. Scale bars, 10 µm