
|
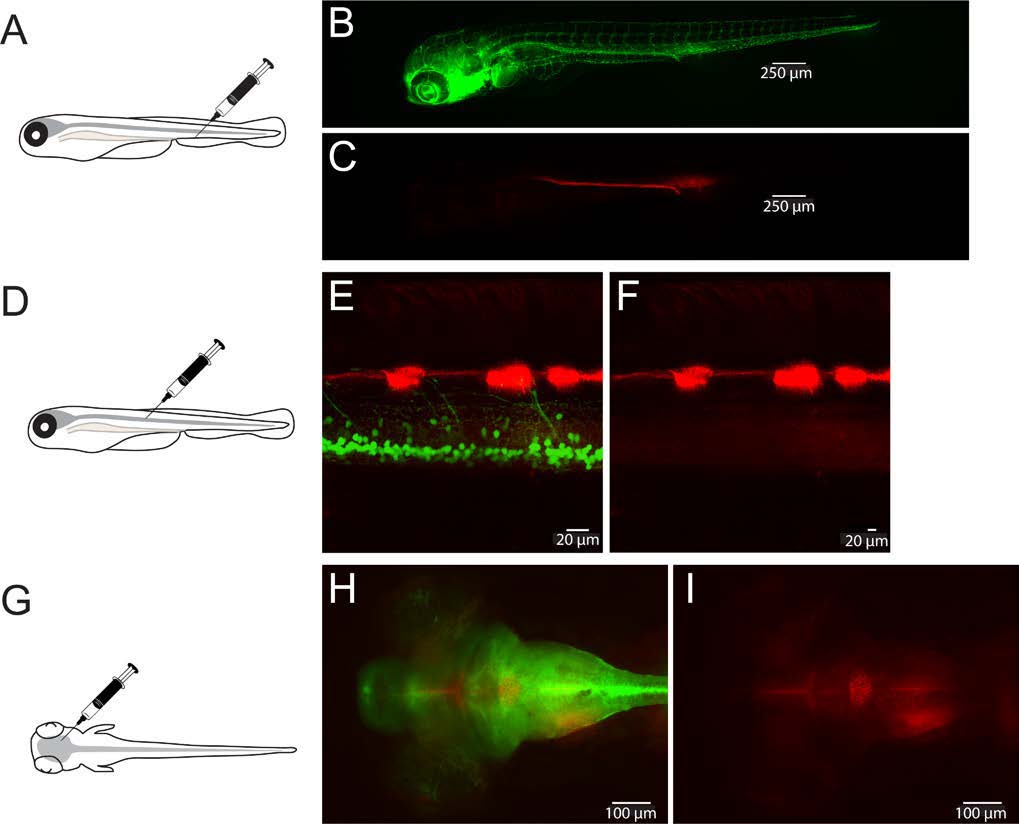
Fig. S7
Visualization of control LissRdB injections in the zebrafish. LissRdB was injected into the vasculature (A-C), the spinal cord (D-F) and the brain (G-I) to compare distribution and brightness to CaP-lipid NPs containing LissRdB-DSPE. (A) Schematic representation of zebrafish and vein injection. (B) Transgenic zebrafish expressing EGFP (green) in the vasculature highlighting blood vessels. (C) Minimal expression of control-LissRdB throughout the vessels two hours after injection. (D) Schematic representation of zebrafish and spinal cord injection. (E) Minimal expression of control-LissRdB throughout the neurons of the spinal cord (green) two hours after injection. (F) Control-LissRdB (red) channel only. (G) Schematic representation of zebrafish and brain injection. (H) Minimal expression of control-LissRdB throughout the brain of a transgenic zebrafish (green) two hours after injection. (F) Control-LissRdB (red) channel only.