
|
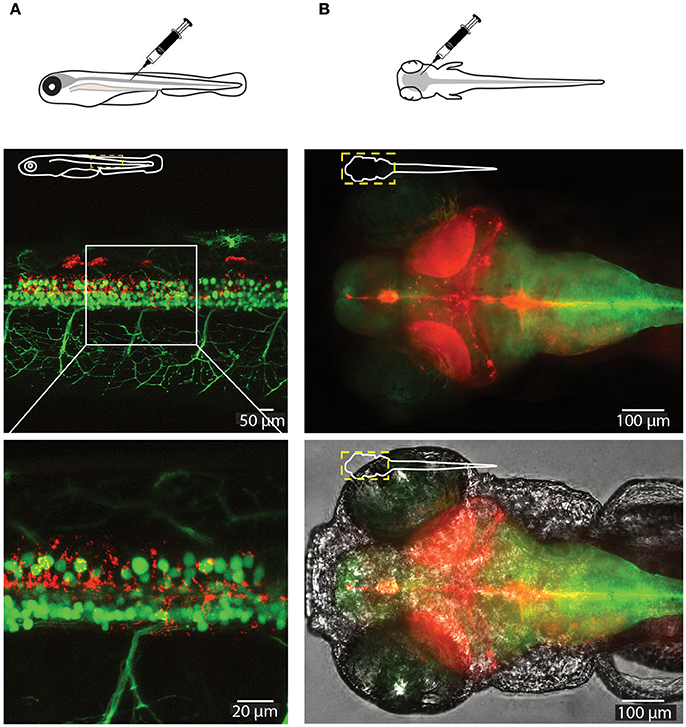
Fig. 4
Visualization of CaP-lipid NPs and neurons in the spinal cord and brain of a 6-dpf zebrafish. Sterile filtered non ASO-loaded CaP-lipid NPs containing LissRdB-DSPE (red) were micro injected into the zebrafish spinal cord (A) and brain (B). (A) Visualization of CaP- lipid NPs containing LissRdB-DSPE (red; injections) within the spinal cord neurons (green; transgenic expression) of a 6-day-old transgenic zebrafish. Zoomed image of the treated zebrafish from area indicated by white box, showing distribution of the CaP-lipid NPs within GFP-expressing spinal cord neurons. (B) Expression of brain-injected CaP-lipid NPs (red) in a transgenic zebrafish expressing astrocyte-specific GFP [green; Tg(GFAP:GFP)] to highlight the brain-specific delivery of these particles. The bottom image overlays the bright-field channel for better visualization of the CNS. The schematic inserts in panels depict the orientation of the fish and outline the presented area.