
|
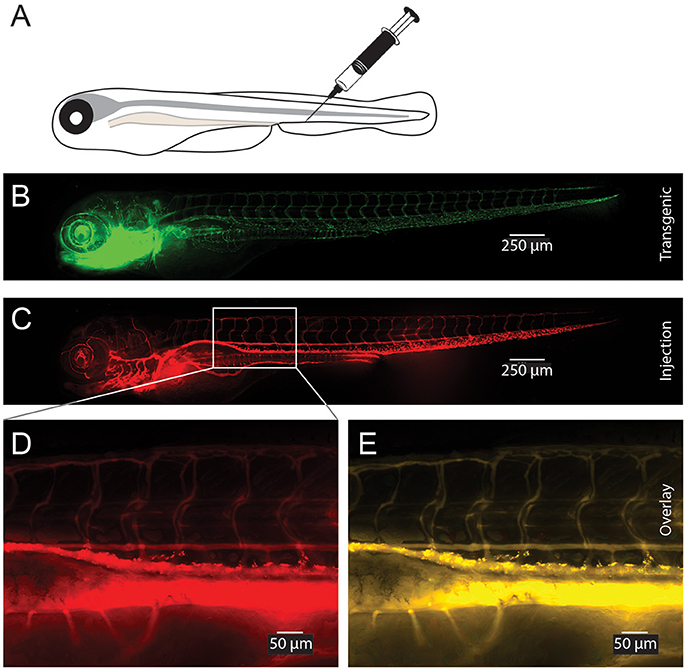
Fig. 3
Visualization of CaP-lipid NPs after tail vein injection in transgenic zebrafish. Sterile filtered non ASO-loaded CaP-lipid NPs containing LissRdB-DSPE (stock, 1:5 or 1:10 v/v) was injected into the vein of zebrafish expressing a green fluorescent reporter in their vasculature (Tg(fli1a:EGFP)). Schematic illustration of the route of injection (A). Expression of EGFP in transgenic fish highlighting the blood vessels (B). Visualization of CaP-lipid NP in 6-day-old transgenic zebrafish 2 h after injection (C). Zoomed image of the treated zebrafish from area indicated by white box, showing distribution and accumulation of CaP-lipid NP in and around blood vessels (D). Overlay of transgenic EGFP expression and CaP-lipid NP distribution (E).