
Image
|
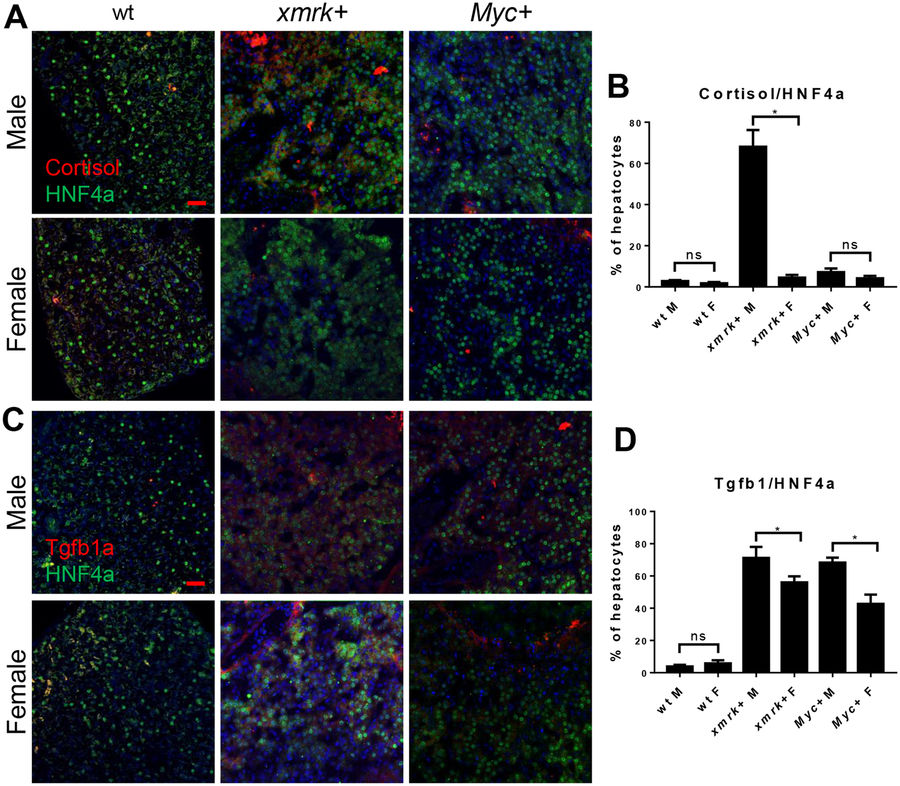
Figure Caption
Fig. 6
Immunofluorescent staining for cortisol and Tgfb1a in the livers of male and female xmrk+ and Myc+ fish following oncogene activation. 10 fish were analyzed in each group and the experiment was repeated once for reproducibility. (A) IF co-staining of cortisol (red) and HNF4a (green) in liver sections. (B) Quantification of ratio of cortisol-expressing hepatocytes in liver sections. (C) IF co-staining of Tgfb1a (red) and HNF4a (green) in liver sections. (D) Quantification of ratio of Tgfb1a-expressing hepatocytes in liver sections.
Acknowledgments
This image is the copyrighted work of the attributed author or publisher, and
ZFIN has permission only to display this image to its users.
Additional permissions should be obtained from the applicable author or publisher of the image.
Full text @ Sci. Rep.