
Image
|
Figure Caption
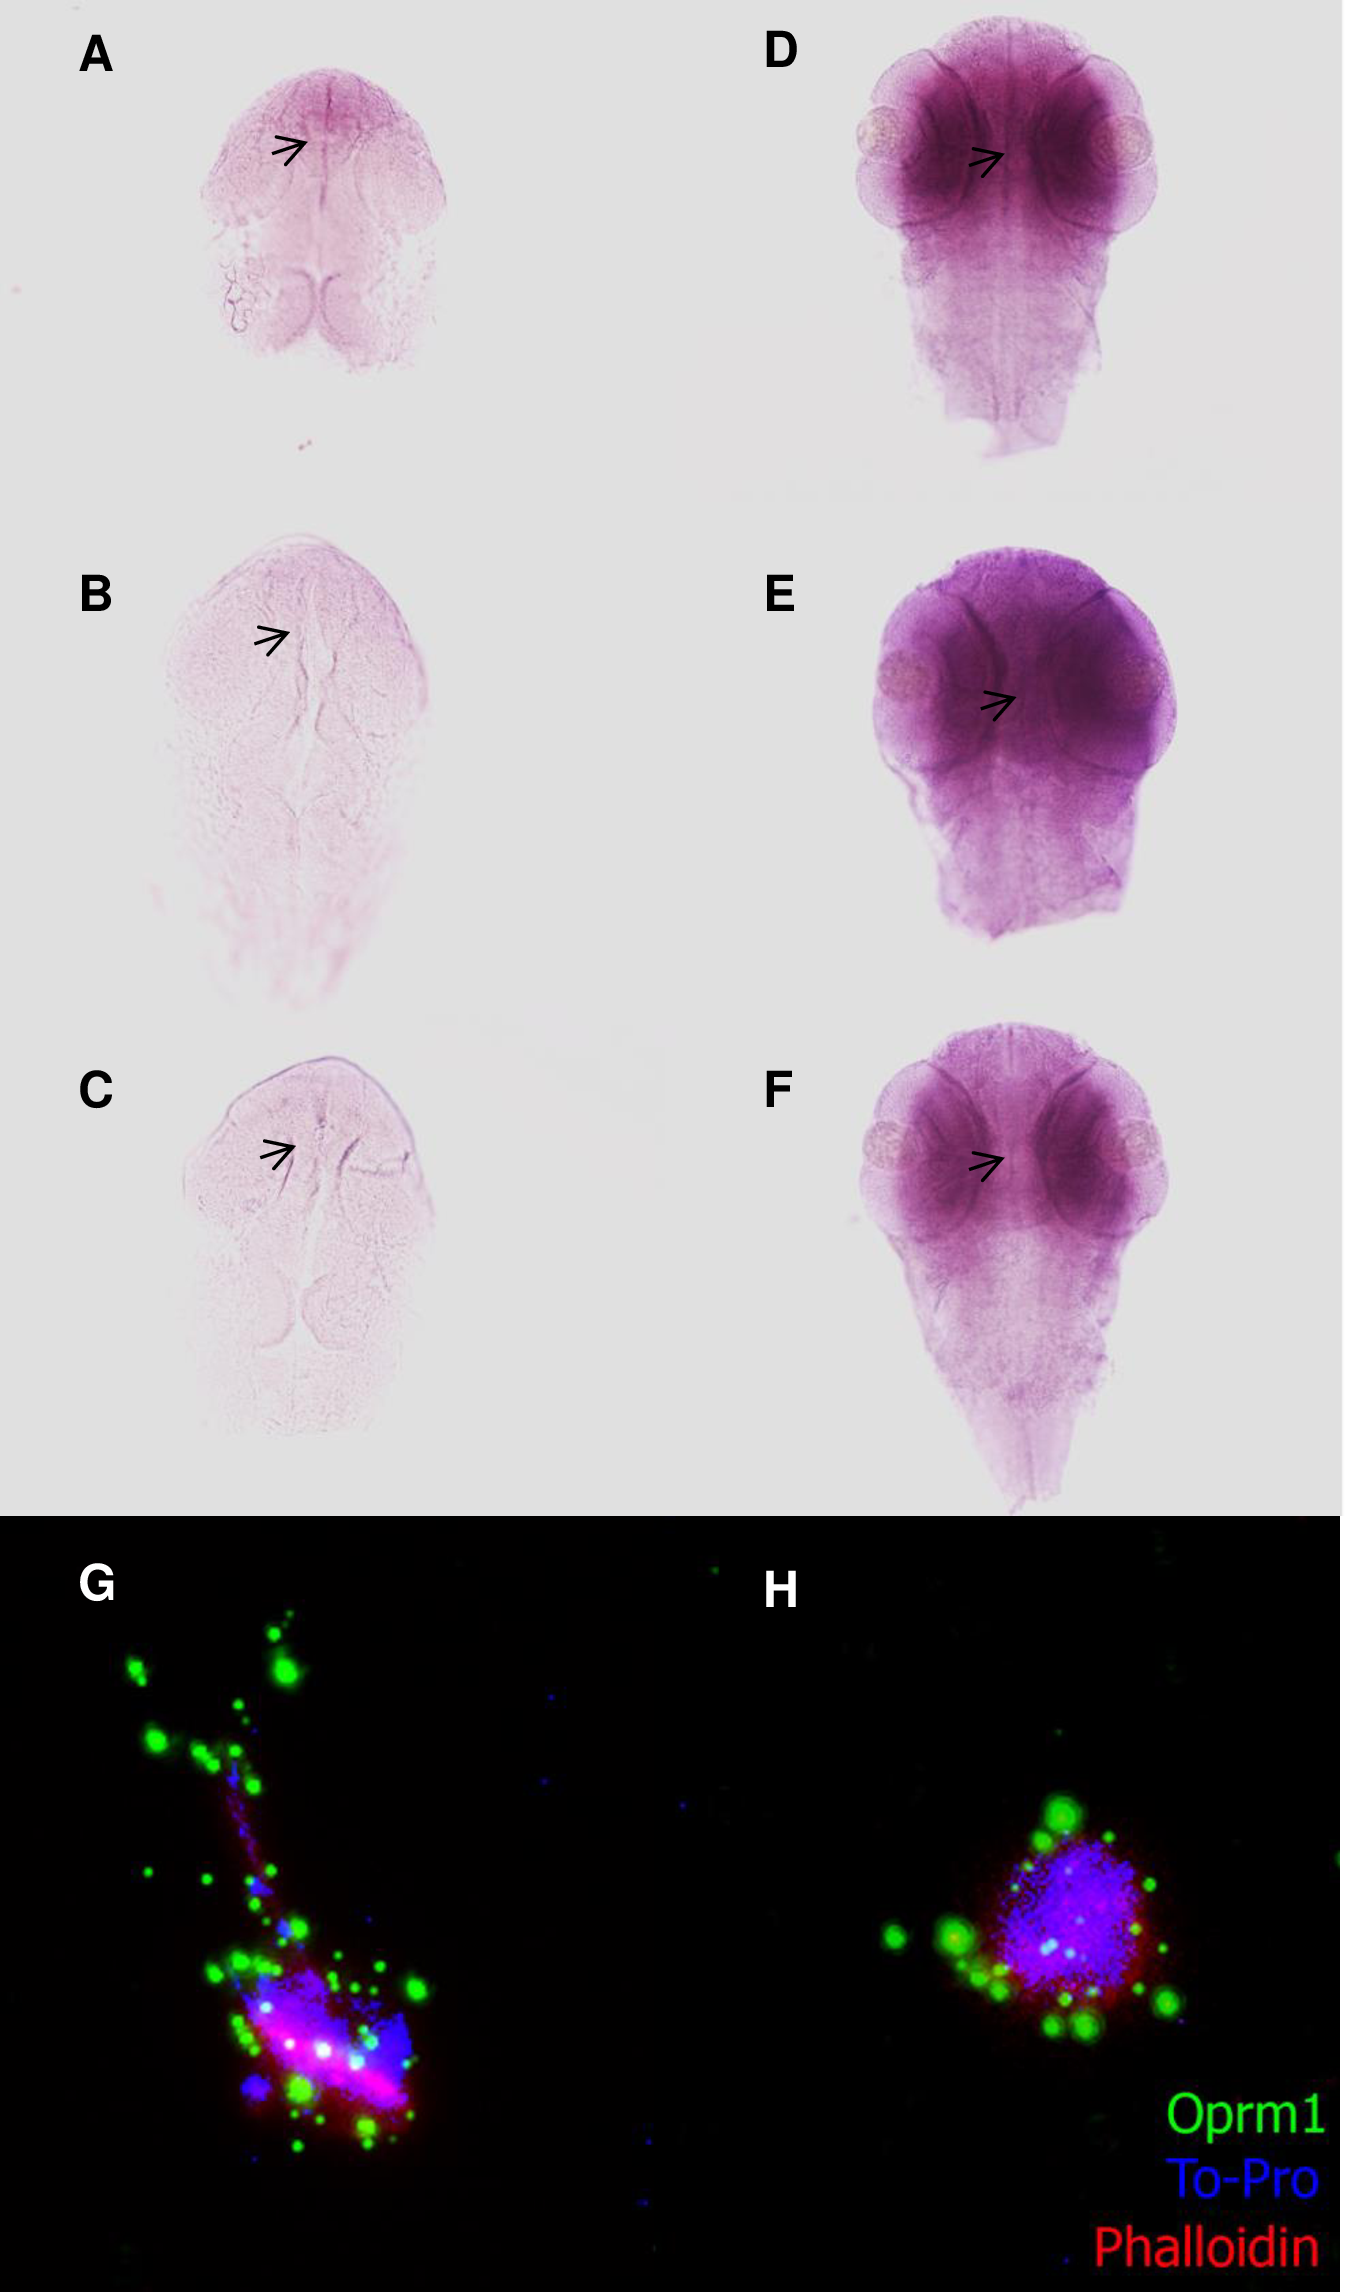
Fig. 4
ISH against miR-212 (A-F) and IHC against Oprm1 (G-H). miR-212 pattern of expression in control (A, D) and after morphine treatment (10 nM (B,E) and 10μM (C,F)) (left, 24hfp; right, 48hpf). Zebrafish primary neuron culture (G, H), control (G) and 1nM morphine (H). The arrows show the regions in the midbrain and in the hindbrain where the changes observed in miR-212 expression levels are more relevant. The IHC performed on the primary neuron culture showed changes in the levels of Oprm1 (green), which correlates with the results observed in the qPCR and ISH experiments.
Acknowledgments
This image is the copyrighted work of the attributed author or publisher, and
ZFIN has permission only to display this image to its users.
Additional permissions should be obtained from the applicable author or publisher of the image.
Full text @ PLoS One