
Image
|
Figure Caption
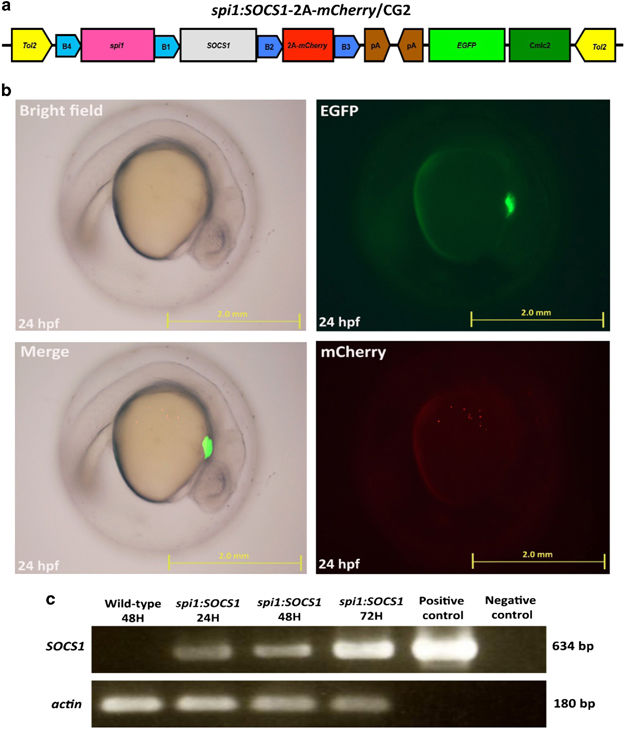
Fig. 2
Generation of transgenic zebrafish expressing human SOCS1 driven by spi1 promoter. (a) Diagram of the spi1:SOCS1-2A-mCherry/CG2 construct, which contains Tol2 sequences and the cmlc2:EGFP expression cassette. (b) Fluorescent images of spi1:SOCS1-2A-mCherry larva at 24 hpf. The red dots denote SOCS1-expressing myeloid cells and the green denotes fluorescent transgenesis marker in the heart. (c) Semi-quantitative PCR showing the expression of SOCS1 in transgenic larva at 24, 48 and 72 hpf. Actin as an internal control. Positive control: plasmid of spi1:SOCS1-2A-mCherry/CG2, Negative control: non-template.
Figure Data
Acknowledgments
This image is the copyrighted work of the attributed author or publisher, and
ZFIN has permission only to display this image to its users.
Additional permissions should be obtained from the applicable author or publisher of the image.
Full text @ Blood Cancer J