
Image
|
Figure Caption
Fig. 2
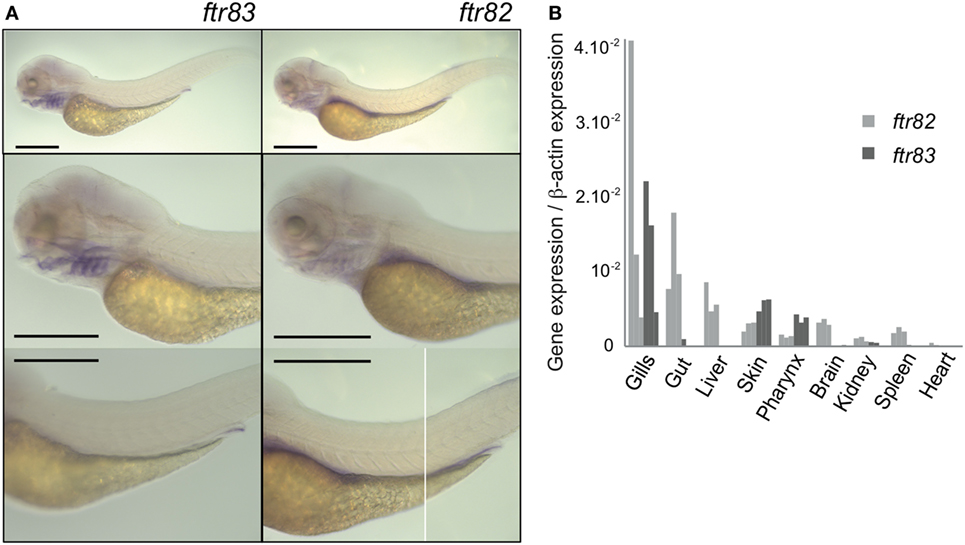
ftr82 and ftr83 expression pattern are distinct. (A) Spatial expression of ftr83 and ftr82 in 3.5 dpf zebrafish larvae. WISH using antisense probes indicated on each panel. Scale bars: 0.5 mm. (B) Genes expression in 2–3 months old juvenile zebrafish, measured by RTQPCR in various dissected tissues. Transcript copy numbers were normalized to β-actin expression: measured ratio of cDNA of interest/β-actin cDNA is shown. Results of three biological replicates, each being a pool of organs from 15 fish.
Figure Data
Acknowledgments
This image is the copyrighted work of the attributed author or publisher, and
ZFIN has permission only to display this image to its users.
Additional permissions should be obtained from the applicable author or publisher of the image.
Full text @ Front Immunol