
Fig. 5
- ID
- ZDB-IMAGE-180108-18
- Publication
- Patra et al., 2017 - The zebrafish ventricle: A hub of cardiac endothelial cells for in vitro cell behavior studies
- All Figures
- Figures for Patra et al., 2017
|
Fig. 5
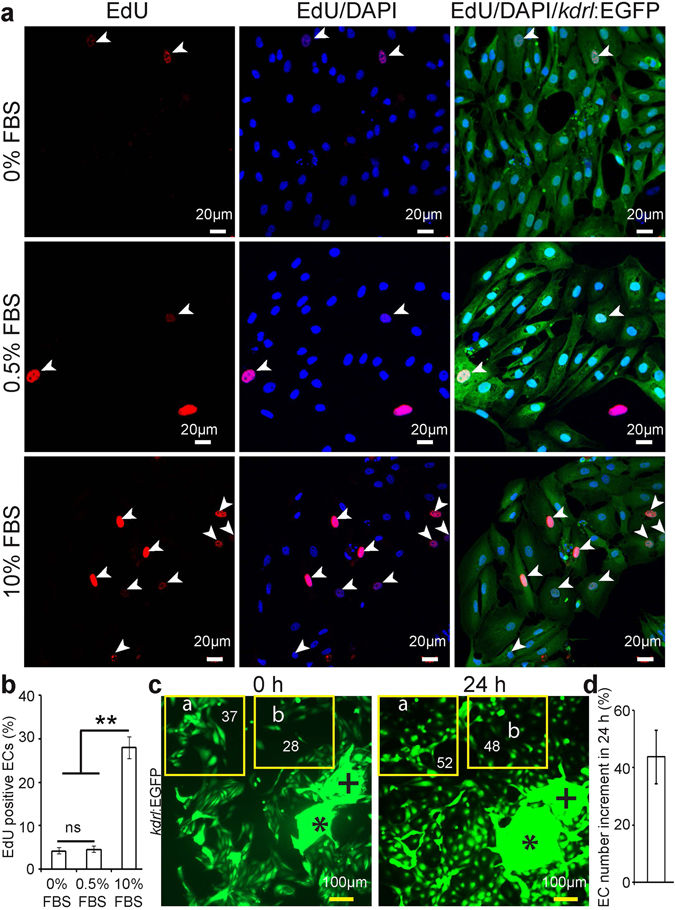
Cardiac endothelial cells proliferate in vitro. 24 h after seeding, ECs were cultured in EGM2 medium supplemented with 0, 0.5 or 10% FBS for 12 h and then analyzed for DNA synthesis using a 12 h pulse of EdU. (a) Representative images of endothelial cells stained for EGFP (green), EdU (red), and DAPI (nuclei, blue). White arrowheads point to EdU-positive endothelial cells. (b) Quantification of EdU+ EGFP+ endothelial cells without or with FBS in the culture medium (n = 3, mean ± SEM). P < 0.05 was considered statistically significant. (c) Example of cell density experiments. Cells were cultured with 10% FBS, resulting in endothelial cell proliferation. Plus and asterisk symbols are depicting landmarks, showing that pictures were taken from the same region for the cell density analysis. Yellow frames indicate areas of analysis. (d) Quantitative analysis of endothelial cell number increment in 24 h (n = 3, mean ± SEM). One way ANOVA followed by Bonferroni’s post-hoc test (GraphPad Prism) was performed to evaluate statistical significance of differences. P < 0.05 was considered statistically significant. ** corresponds to P < 0.05.