
Image
|
Figure Caption
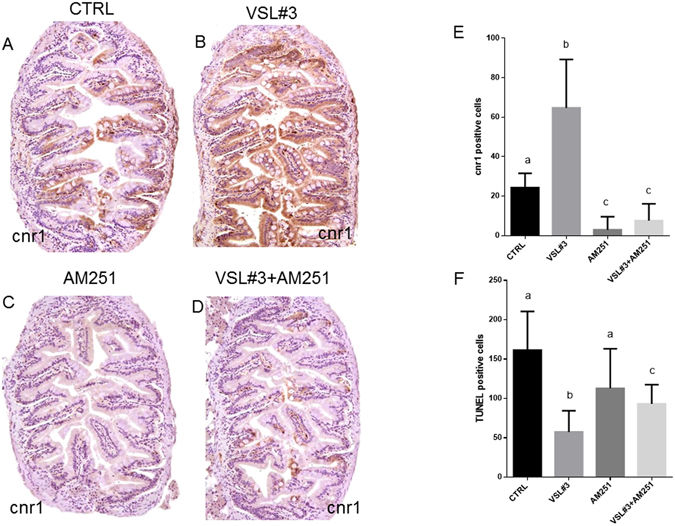
Fig. 6
Intestinal distribution of cnr1 by IHC in different experimental groups from ex vivo experimentation: (A) Control; (B) VSL#3; (C) AM251; (D) VSL#3 + AM251. (E) Cnr1 protein levels by IHC and (F) TUNEL positive cell count in the same ex vivo experimental groups. Values indicate mean ± SD. Different letters denote significant differences among groups.
Acknowledgments
This image is the copyrighted work of the attributed author or publisher, and
ZFIN has permission only to display this image to its users.
Additional permissions should be obtained from the applicable author or publisher of the image.
Full text @ Sci. Rep.