
|
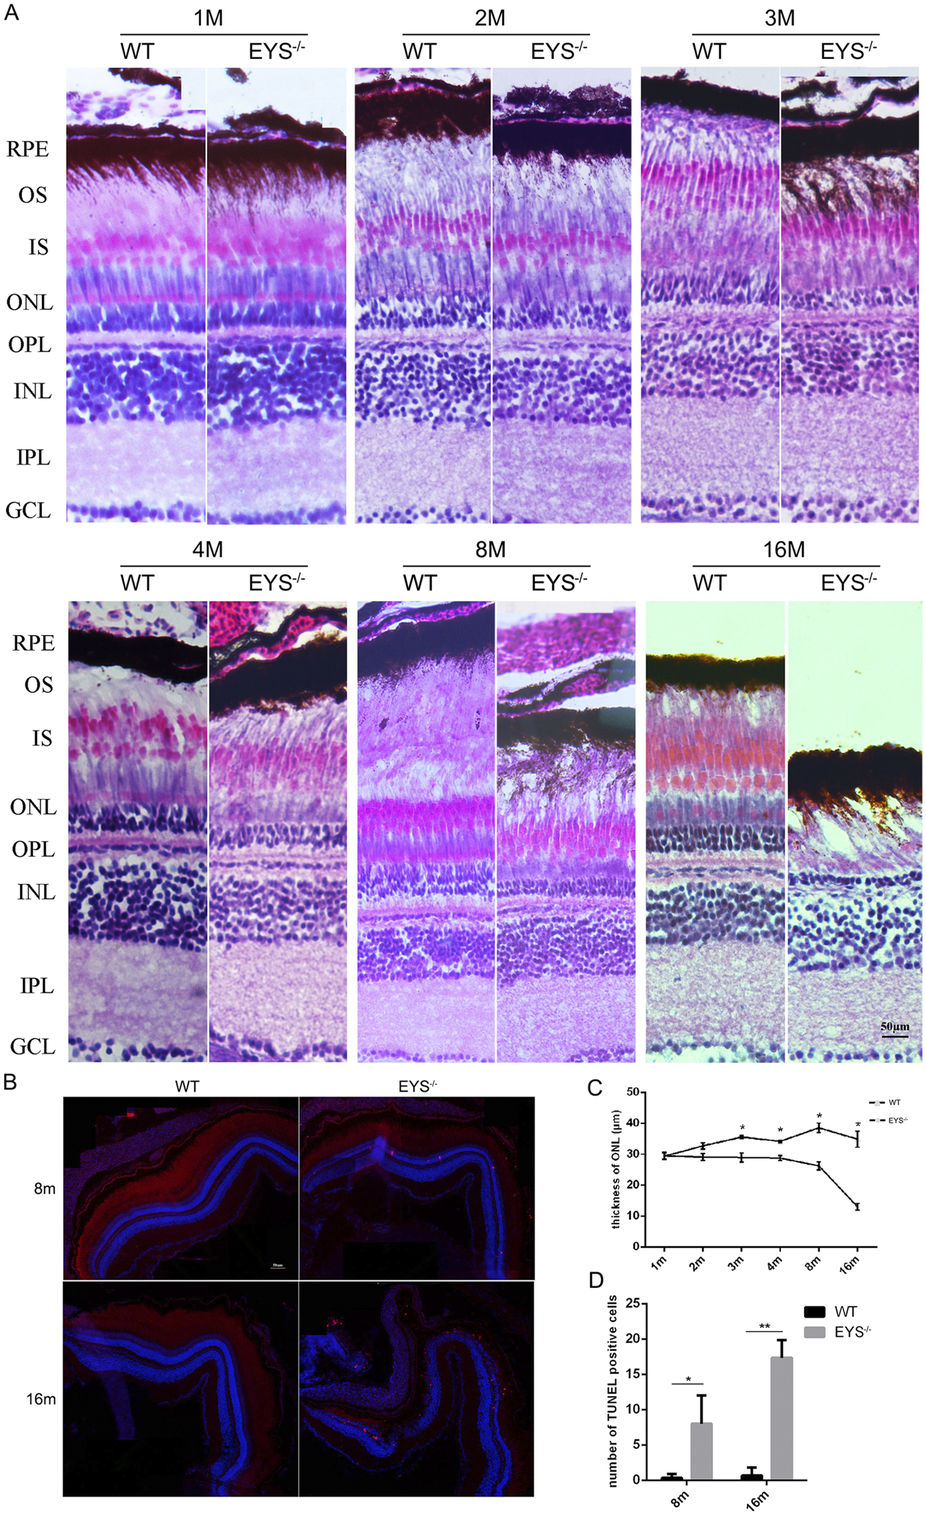
Fig. 3
The thickness of ONL decreased and the apoptosis of retinal cells increased in the EYS−/− zebrafish.
(A) Retinal histology analysis of WT and EYS−/− zebrafish. Retinal sections of EYS−/− zebrafish stained with hematoxylin/eosin (HE) at indicated ages. RPE, retinal pigment epithelium; OS, outer segment; IS, inner segment; ONL, outer nuclear layer; OPL, outer plexiform layer; INL, inner nuclear layer; IPL, inner plexiform layer; GCL, ganglion cell layer. Scale bars: 50 μm. (B) TUNEL staining between WT and EYS−/− zebrafish. Scale bars: 50 μm. (C) Comparison of the ONL thickness between WT and EYS−/− zebrafish at indicated ages (n = 3). Quantitative analysis revealed a significant reduction of the ONL thickness at 3 mpf (P = 0.0479), 4 mpf (P = 0.0258), 8 mpf (P = 0.0122), 16 mpf (P = 0.0272) in the EYS−/− zebrafish. (D) Quantification of TUNEL positive cells in WT and EYS−/− zebrafish at indicated ages (n = 3). Quantitative analysis revealed a significant increase of TUNEL positive cells at 8 mpf (P = 0.0341), 16 mpf (P = 0.0028) in the EYS−/− zebrafish.