
|
Fig. S2
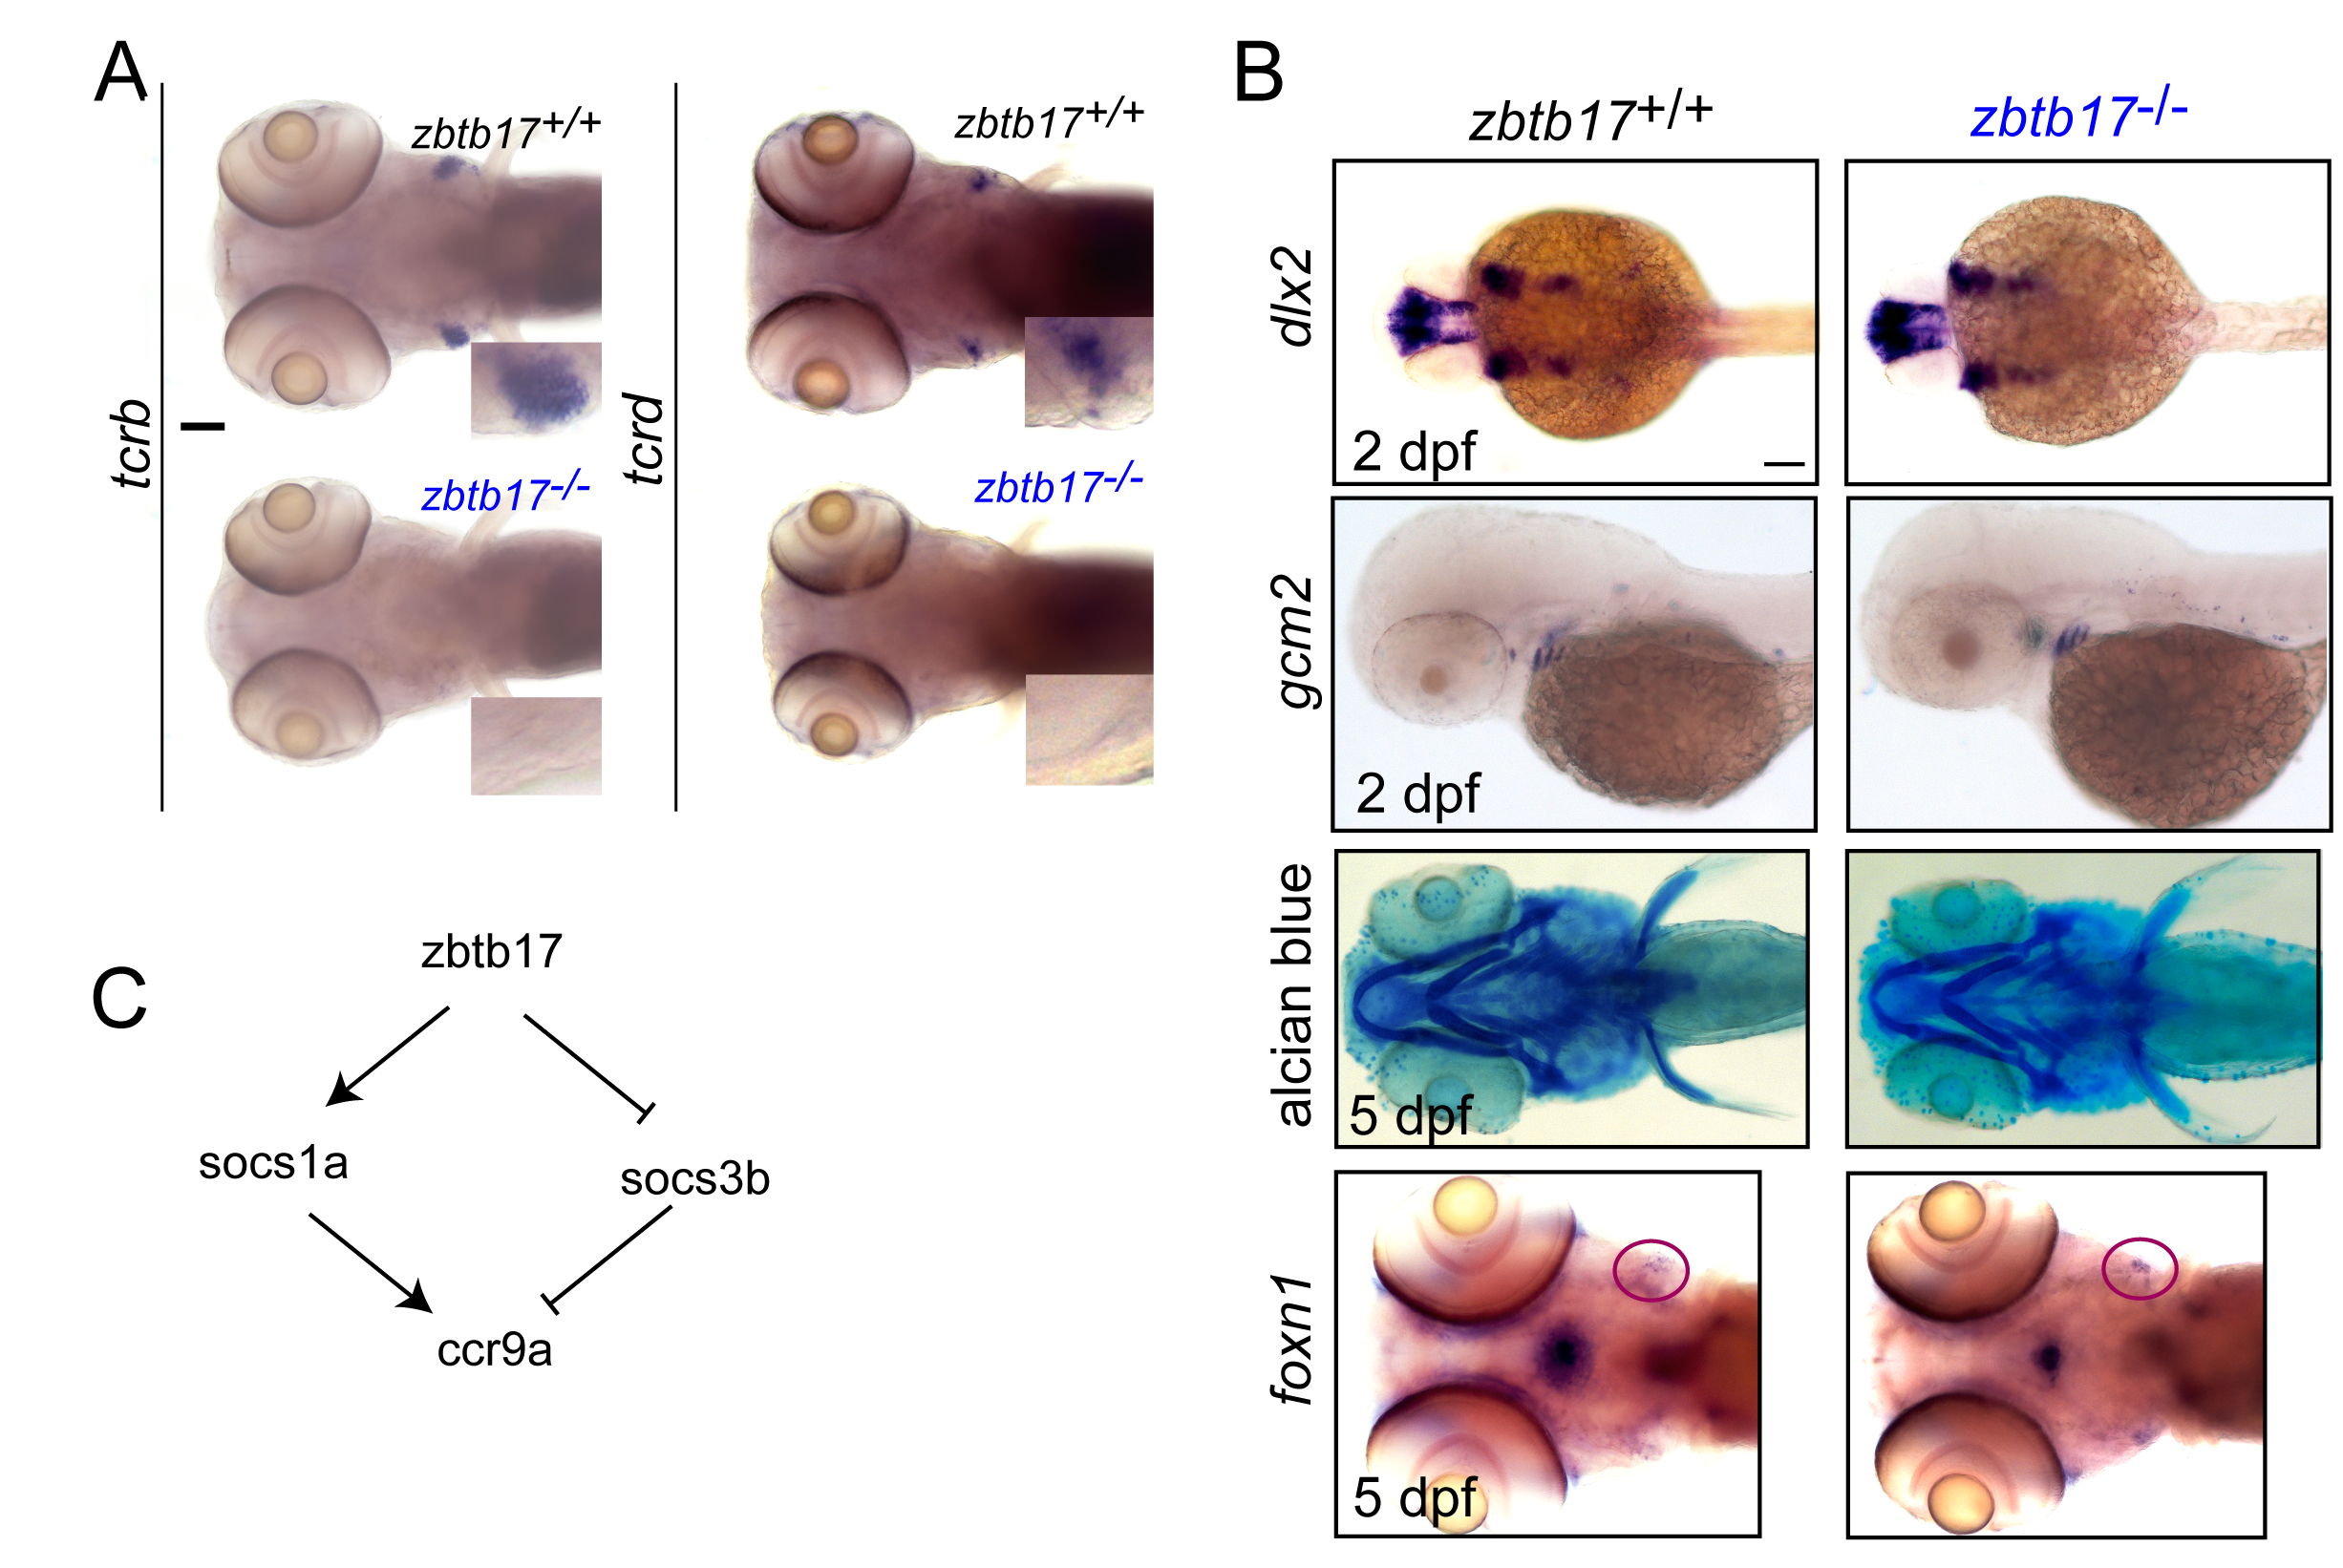
Characterization of zbtb17 mutants.
(A) Representative microphotographs of wild-type and zbtb17 mutant embryos after RNA in situ hybridization with tcrb and tcrd gene-specific probes at 5 dpf. Insets represent magnifications of the thymic regions. No signal is detectable in zbtb17 mutants. (B) Microphotographs of wild-type and zbtb17 mutant embryos after RNA in situ hybridization with the indicated gene-specific probes and at the indicated times of development. Alcian blue staining was used to visualize craniofacial cartilaginous structures. (C) Schematic of the network regulating ccr9a expression. Scale bars, 100 μm.