
|
Fig. 4
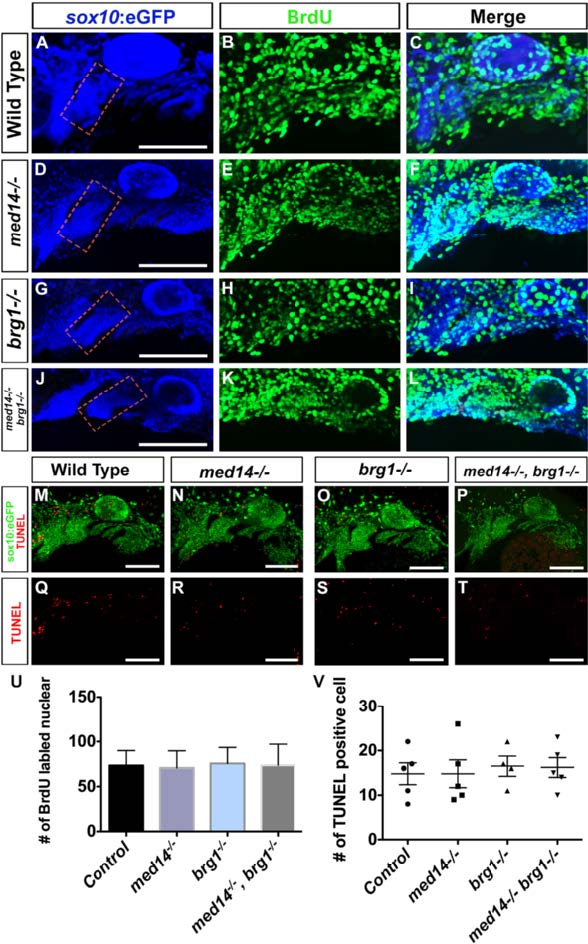
No apparent alterations in cell proliferation and cell death in arch-forming regions of mutant embryos. a to l Cell proliferation at 36 hpf was analyzed through BrdU incorporation. Neural crest cells were marked by sox10:EGFP transgene and revealed by immunostaining with anti-GFP antibody. Proliferating cells were marked by BrdU then revealed by immunostaining with anti-BrdU antibody. Lateral views with anterior to left. m to t Cell death at 36 hpf was analyzed through TUNEL assay. Lateral views with anterior to left. u Quantification of BrdU-positive cell in 2nd arch (dotted squares in a, d, g and j) in control and mutant embryos. Bars represent the SD. v Quantification of TUNEL positive cell in one side of pharyngeal arches in control and mutant embryos at 36 hpf. Bars represent the SD. Scale bars, 100 um