
|
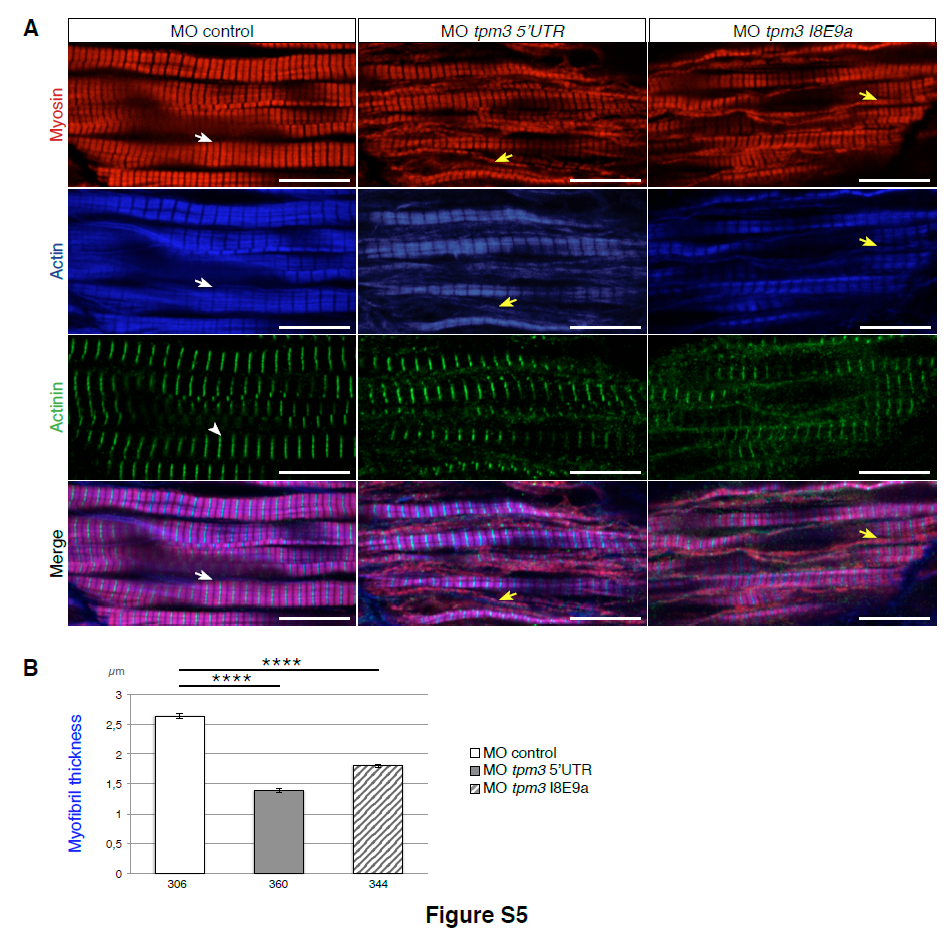
Fig. S5
Related to Figure 5. Tropomyosin 3 loss of function leads to moderate myofibril defects at 26 hpf.
(A) Confocal imaging of myosin (red), actin (blue) and actinin (green) immunostaining in 26 hpf WT embryos injected with control MO or tpm3 MO targeting either the 5'UTR or the exon/intron junction I8E9a (lateral view from single optical section). Slow muscle myofibrils in control morphant embryos (n=39) display the typical actin and myosin striated pattern (white arrow) with sharp bands of actinin (white arrowhead). Striated myofibrils are also present in both types of tpm3 morphant embryos (MO 5'UTR, n= 34) and MO I8E9a (n=42), but they display splitting defects (yellow arrow). In all panels, anterior is to the left. Scale bar 10μm.
(B) Quantification of the myofibril phenotype illustrated in A. In both type of tpm3 morphant embryos, myofibrils are thinner compared to WT embryos injected with control MO (Student’s t-test, P=2x10-73 and 8.5x10-37 respectively). For each condition, 4 embryos were analysed. Numbers under the graph indicate the total number of quantified myofibrils. Data are represented as mean +/- SEM.
Reprinted from Developmental Cell, 42(5), Bonnet, A., Lambert, G., Ernest, S., Dutrieux, F.X., Coulpier, F., Lemoine, S., Lobbardi, R., Rosa, F.M., Quaking RNA-Binding Proteins Control Early Myofibril Formation by Modulating Tropomyosin, 527-541.e4, Copyright (2017) with permission from Elsevier. Full text @ Dev. Cell