
|
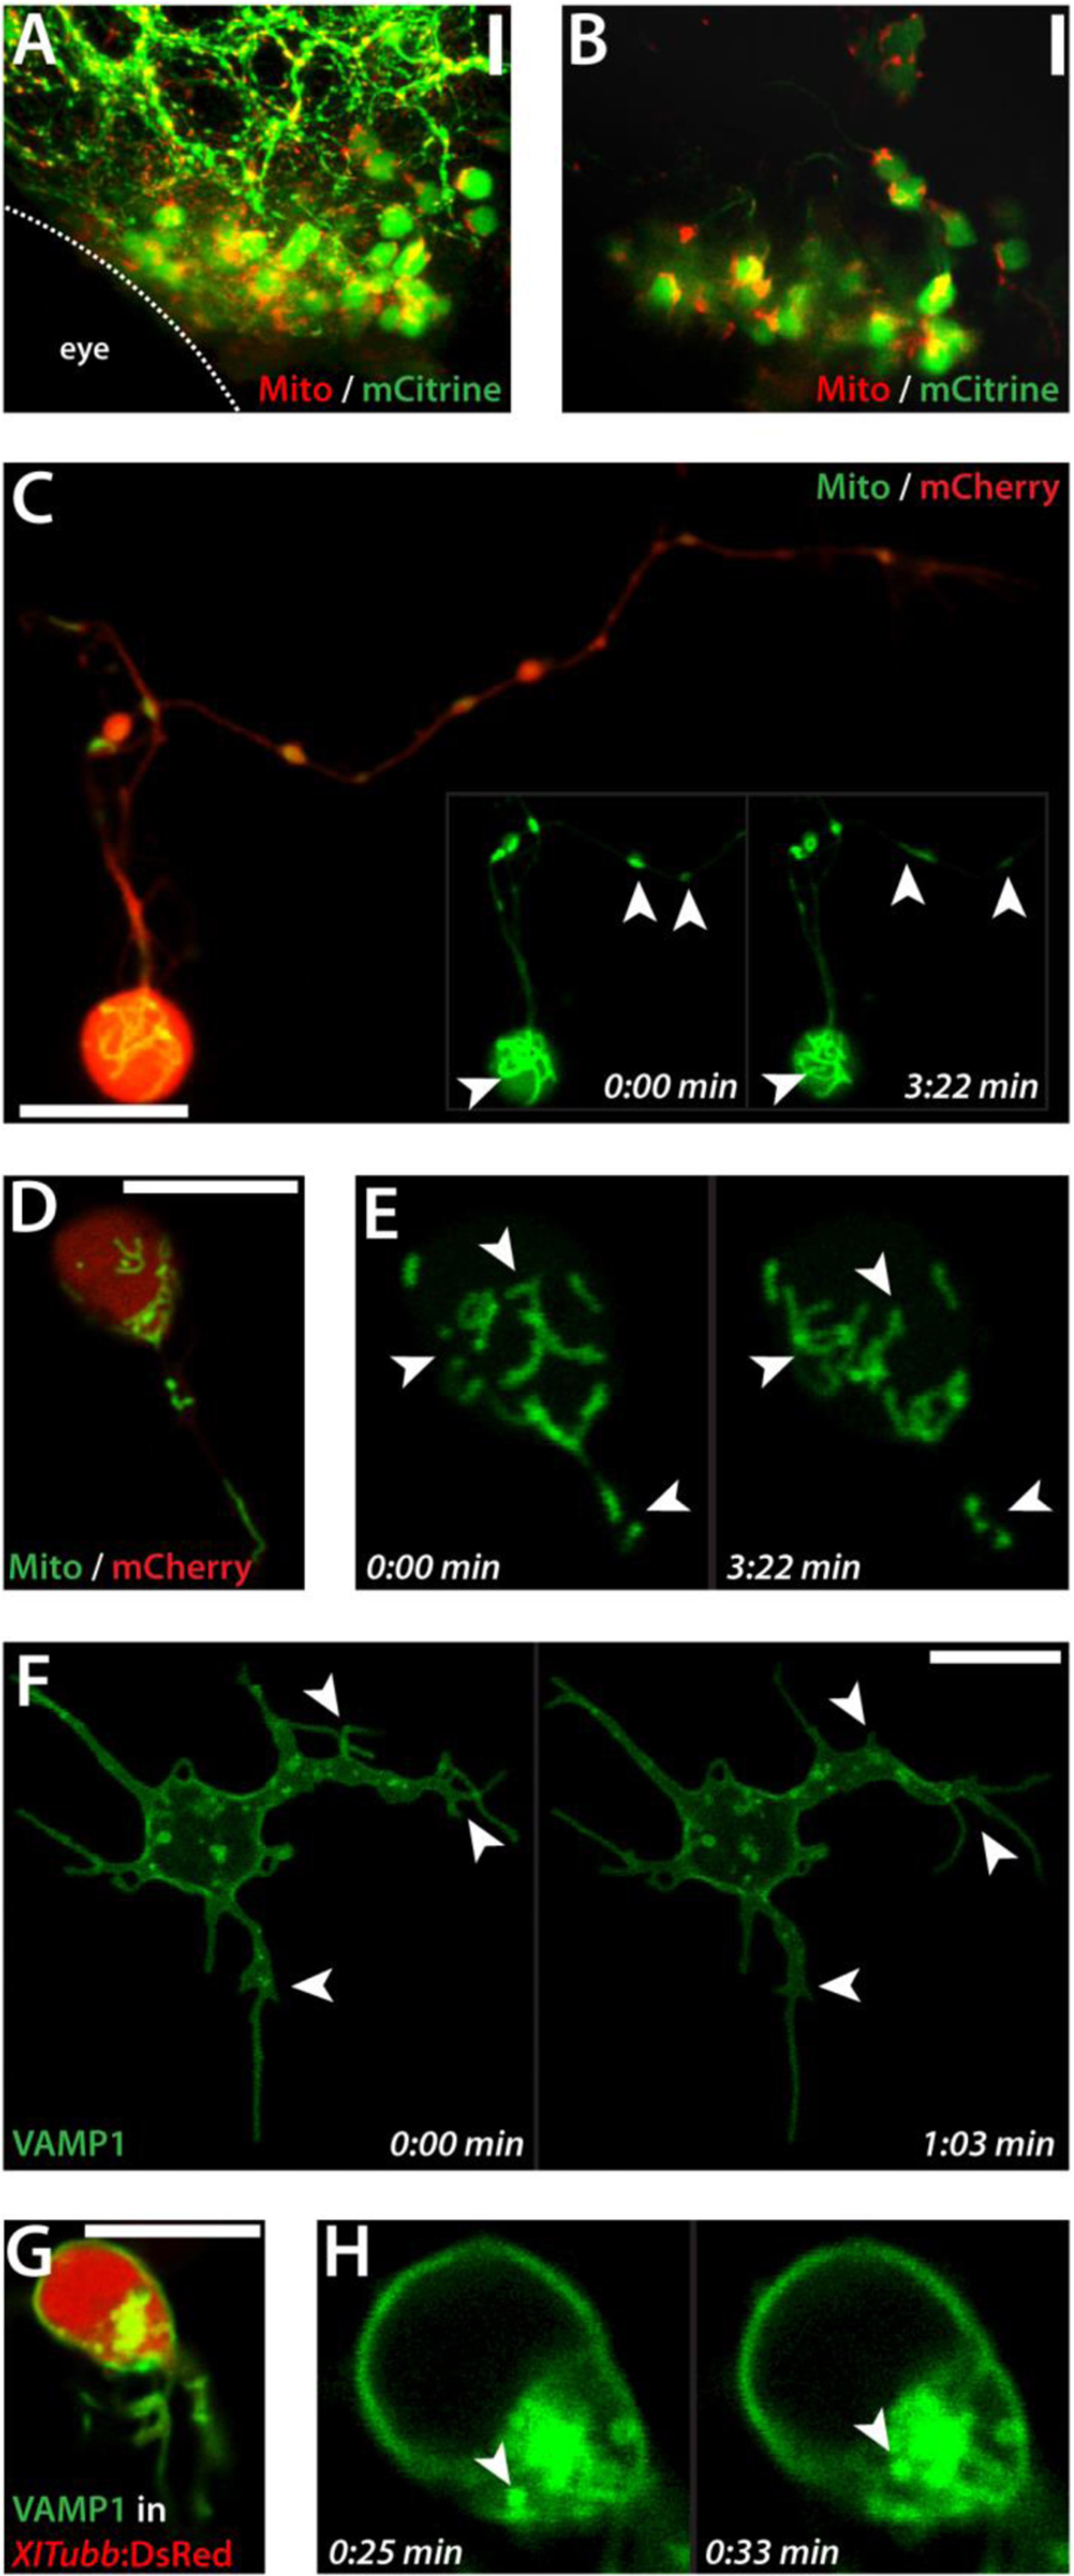
Fig. 10
Imaging of subcellular dynamics. (A) Maximal projection of a Z-stack showing cells in the midbrain of a 3 dpf embryo double-transfected with pCS-mCitrine and pCS-MitoTag-RFP. Anterior is to the left. Shown is one embryo out of several successful electroporated embryos from one electroporation approach. (B) Magnified single plane from the Z-stack projection shown in (A), zoomed in. (C) Putative motorneuron in culture co-transfected with pCS-MitoTag-YFP and pCS-mCherry (1 dap). Inset: Two frames of Movie 3 visualizing the dynamics of mitochondria (arrowheads). (D) Neuron-like cell in culture (1 dap) co-transfected with pCS-MitoTag-YFP and pCS-mCherry (1 dap). Mitochondria in the cell body are highly dynamic as shown by two frames of Movie 4 displayed in (E). (F) Cultured cell (1 dap) transfected with pCS-VAMP1-mCitrine. Two frames of Movie 5 are shown. Arrowheads label the dynamic changes of cellular projections. (G) XITubb:DsRed-cell in culture (1 dap) transfected with pCS-VAMP1-mCitrine. (H) Two frames of a time lapse showing the cell body of the cell shown in (G). Arrowheads label the movement of a single vesicle. Scale bars, 10 µm. Each transfection was at least performed three times. The figure shows a collection of images obtained from several preparations.
Reprinted from Developmental Biology, 430(1), Sassen, W.A., Lehne, F., Russo, G., Wargenau, S., Dübel, S., Köster, R.W., Embryonic zebrafish primary cell culture for transfection and live cellular and subcellular imaging, 18-31, Copyright (2017) with permission from Elsevier. Full text @ Dev. Biol.