
|
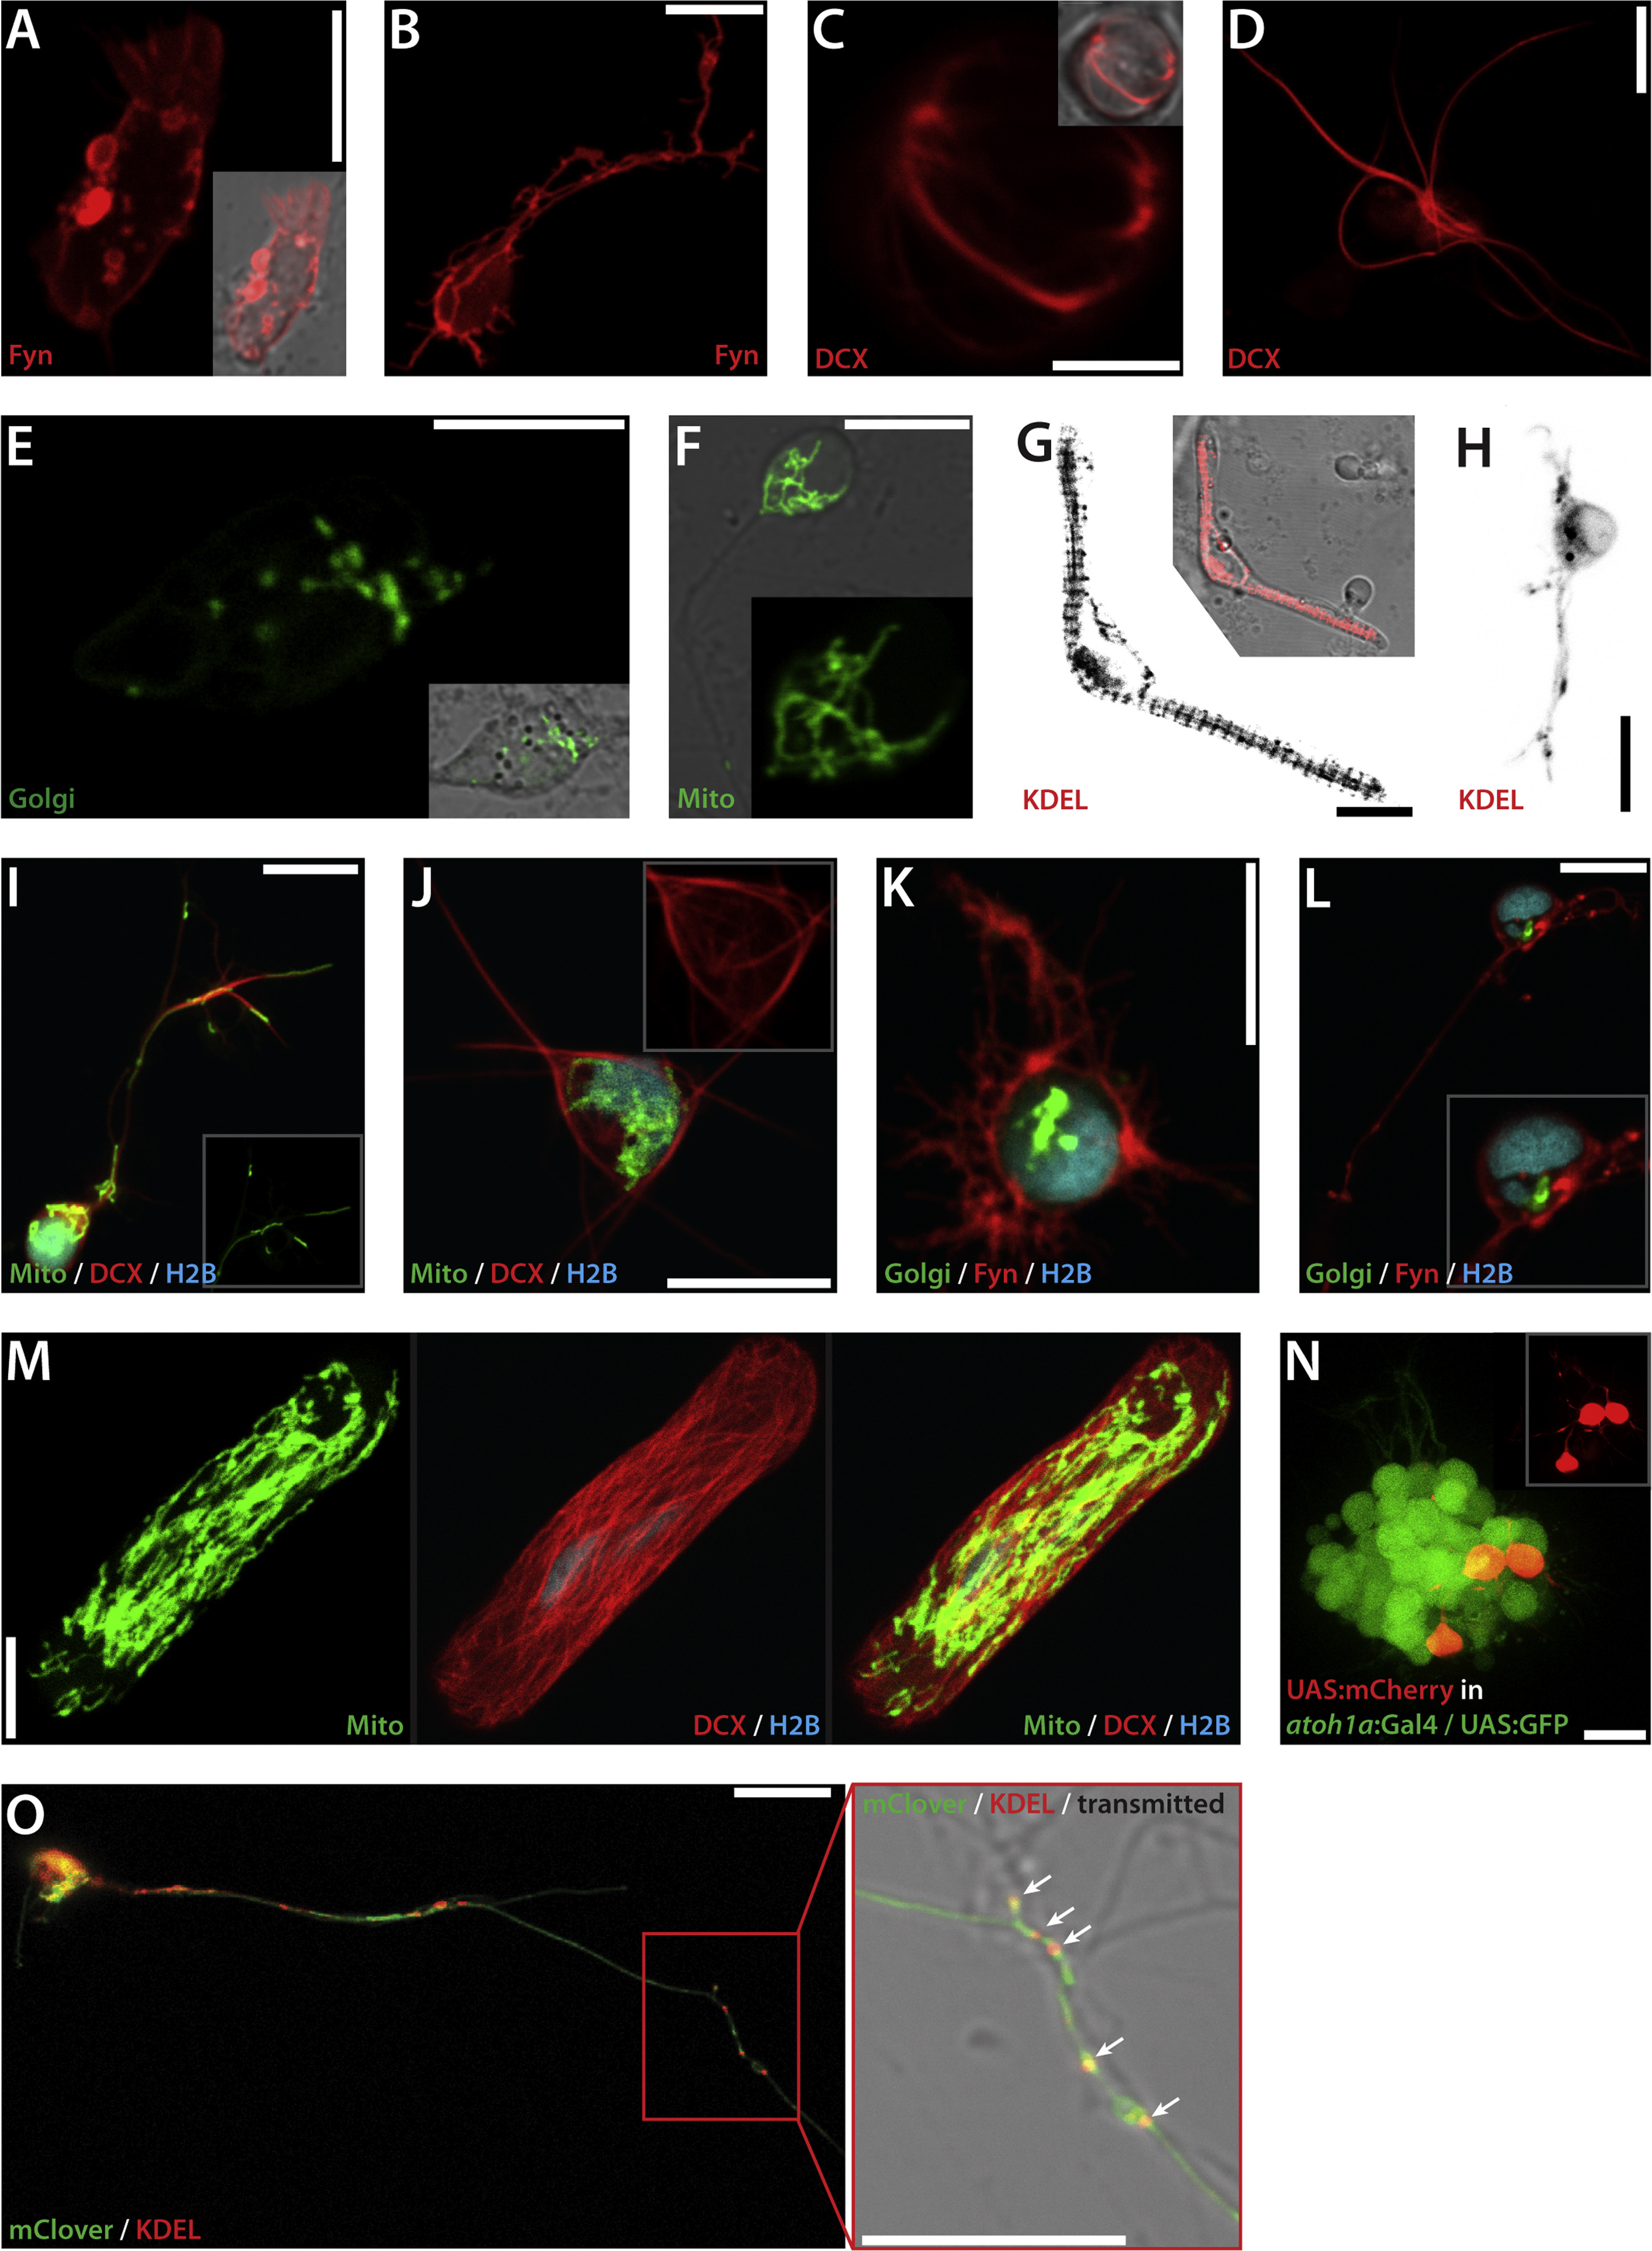
Fig. 9
Visualization of subcellular structures in live primary cells. (A) Fibroblast-like cell transfected pCS-Fyn-TagRFP-T (1 dap). Inset: Merged picture of fluorescent and transmitted light channels. (B) Neuron-like cell transfected with pCS-Fyn-TagRFP-T (1 dap). (C) Putative mitotic spindle of a cell transfected with pCS-DCX-tdTomato. Inset: Merged picture of fluorescent and transmitted light channels. (D) Cell with several membrane protrusions highlighted by DCX-tdTomato-labeled microtubules (2 dap). (E) Cell transfected with pCS-Golgi-YFP (3 dap). (F) Neuron-like cell transfected with pCS-MitoTag-YFP (2 dap). Inset: Mitochondria in the cell body in detail. (G) Myocyte transfected with ss-RFP-KDEL (2 dap). The ER is distributed in a “striated” organization. Inset: Merged picture of fluorescent and transmitted light channels. (H) Putative neuron transfected with ss-RFP-KDEL (2 dap). (I) Neuron-like cell triple transfected with pCS-MitoTag-YFP, pCS-DCX-tdtomato and pCS-H2B-mseCFP (2 dap). Inset: Mitochondria in the process. (J) Triple-transfected cell with pCS-MitoTag-YFP, pCS-DCX-tdtomato and pCS-H2B-mseCFP (3 dap). Inset: Microtubular network in the cell body in detail. (K) Triple-transfected cell with pCS-Golgi-YFP, pCS-Fyn-TagRFP-T and pCS-H2B-mseCFP (2 dap). (L) Neuron-like cell triple-transfected with pCS-GolgiTag-YFP, pCS-Fyn-TagRFP-T and pCS-H2B-mseCFP (3 dap). Inset: Cell body in detail. (M) Myocyte triple-transfected with pCS-MitoTag-YFP, pCS-DCX-tdtomato and pCS-H2B-mseCFP (3 dap). Both mitochondria and microtubules form a network in the whole cell. (N) atoh1a-positive neuronal progenitors isolated from Tg(atoh1a:Gal4TA4)hzm2 / Tg(4xUAS:KGFPGI)hzm3 embryos transfected with pSK-UAS:mCherry. Inset: Red fluorescent channel highlighting neuronal processes of individual transfected cells. (O) Putative motorneuron double-transfected with pCS-mClover and ss-RFP-KDEL. The ER is distributed in the axon in a dot-like manner. Scale bars, 10 µm. Each transfection was at least performed two times. The figure shows a collection of images obtained from several preparations.
Reprinted from Developmental Biology, 430(1), Sassen, W.A., Lehne, F., Russo, G., Wargenau, S., Dübel, S., Köster, R.W., Embryonic zebrafish primary cell culture for transfection and live cellular and subcellular imaging, 18-31, Copyright (2017) with permission from Elsevier. Full text @ Dev. Biol.