
|
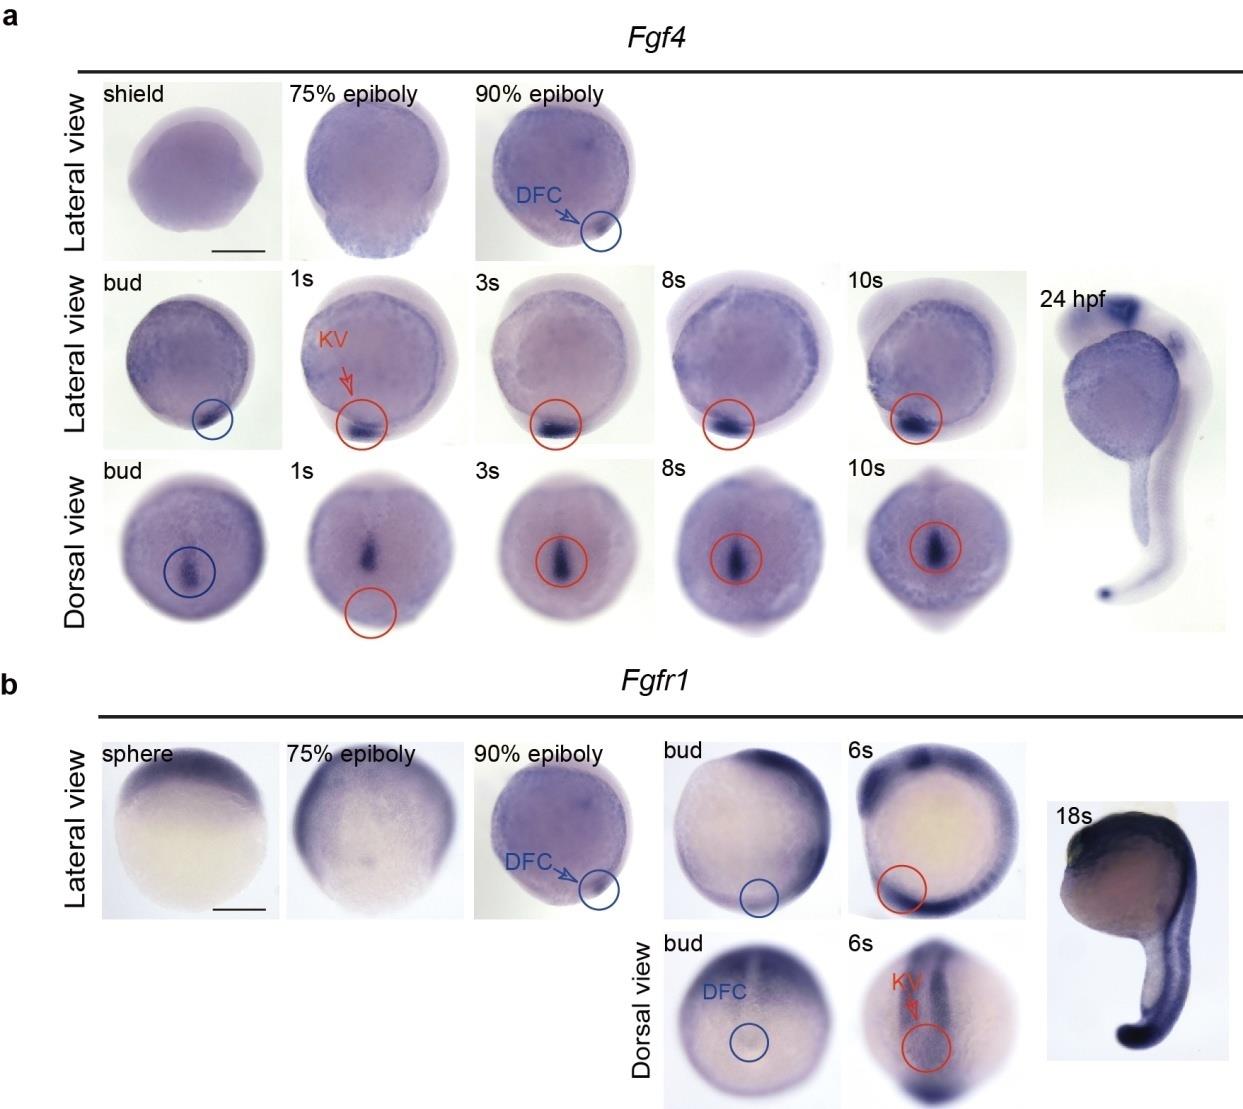
Fig. S8
The spatiotemporal distribution of the mRNA of fgf4 andfgfr1 in zebrafish embryos.
(a) Fgf4 was predominantly expressed in DFCs (blue circles), KV (red circles) and its peripheral region. Fgf4 was also detected at the posterior notochord. At 24 hpf,fgf4 was expressed in the midbrain–hindbrain boundary, pharyngeal arch and tail bud. (b) Weak expression of fgfr1 RNA was detected in DFCs (blue circles) and in KV (red circles) of wild-type embryos. At 6s stage, fgfr1 was also expressed in mesoderm, somite, eye field and hindbrain. The mRNA was detected in wild-type embryos by WISH. Lateral views show dorsal to the right and the head from the top; dorsal views show the head from the top. s, somite. Scale bar, 250 μm.