
Image
|
Figure Caption
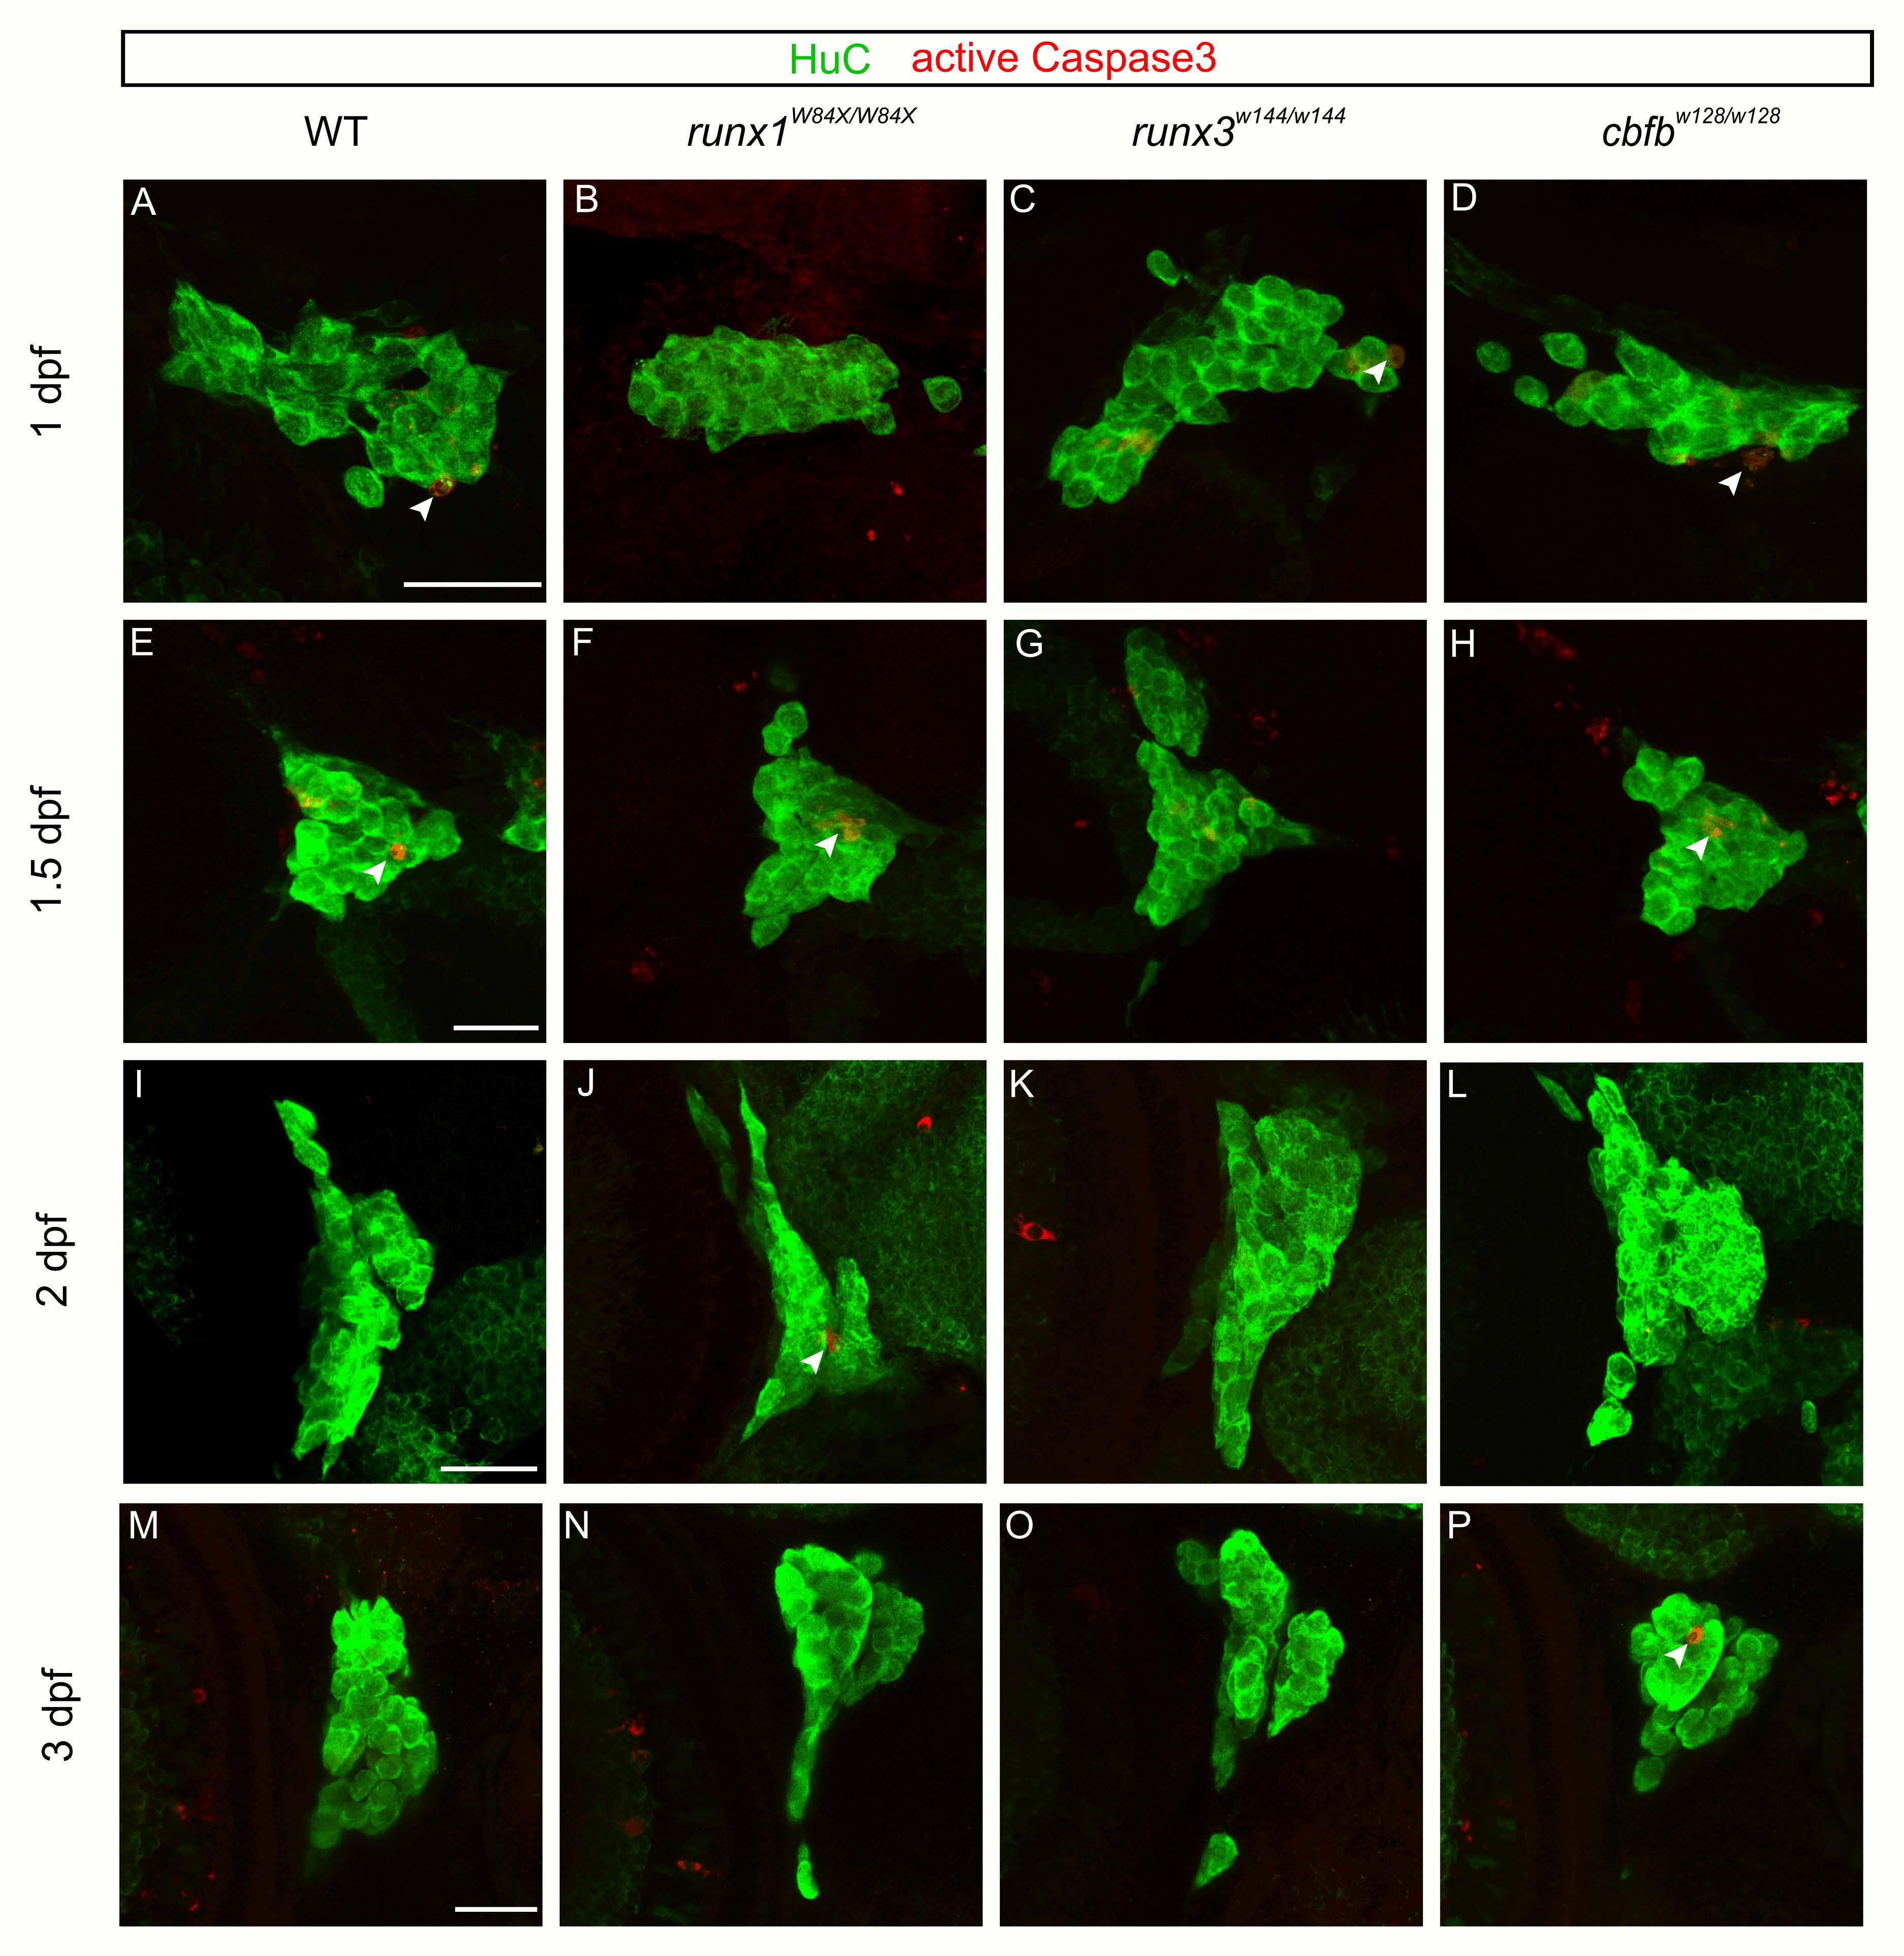
Fig. S6
Loss of runx or cbfb expression did not affect anti-active caspase3 staining.
A-P, Maximum intensity projections of antibody staining for HuC (green) and active caspase3 (red) at 1dpf (A-D), 1.5dpf (E-H), 2dpf (I-L), or 3dpf (M-P) Scale bar: 20μm.
Acknowledgments
This image is the copyrighted work of the attributed author or publisher, and
ZFIN has permission only to display this image to its users.
Additional permissions should be obtained from the applicable author or publisher of the image.
Full text @ PLoS Genet.