
|
Fig. 3 S1
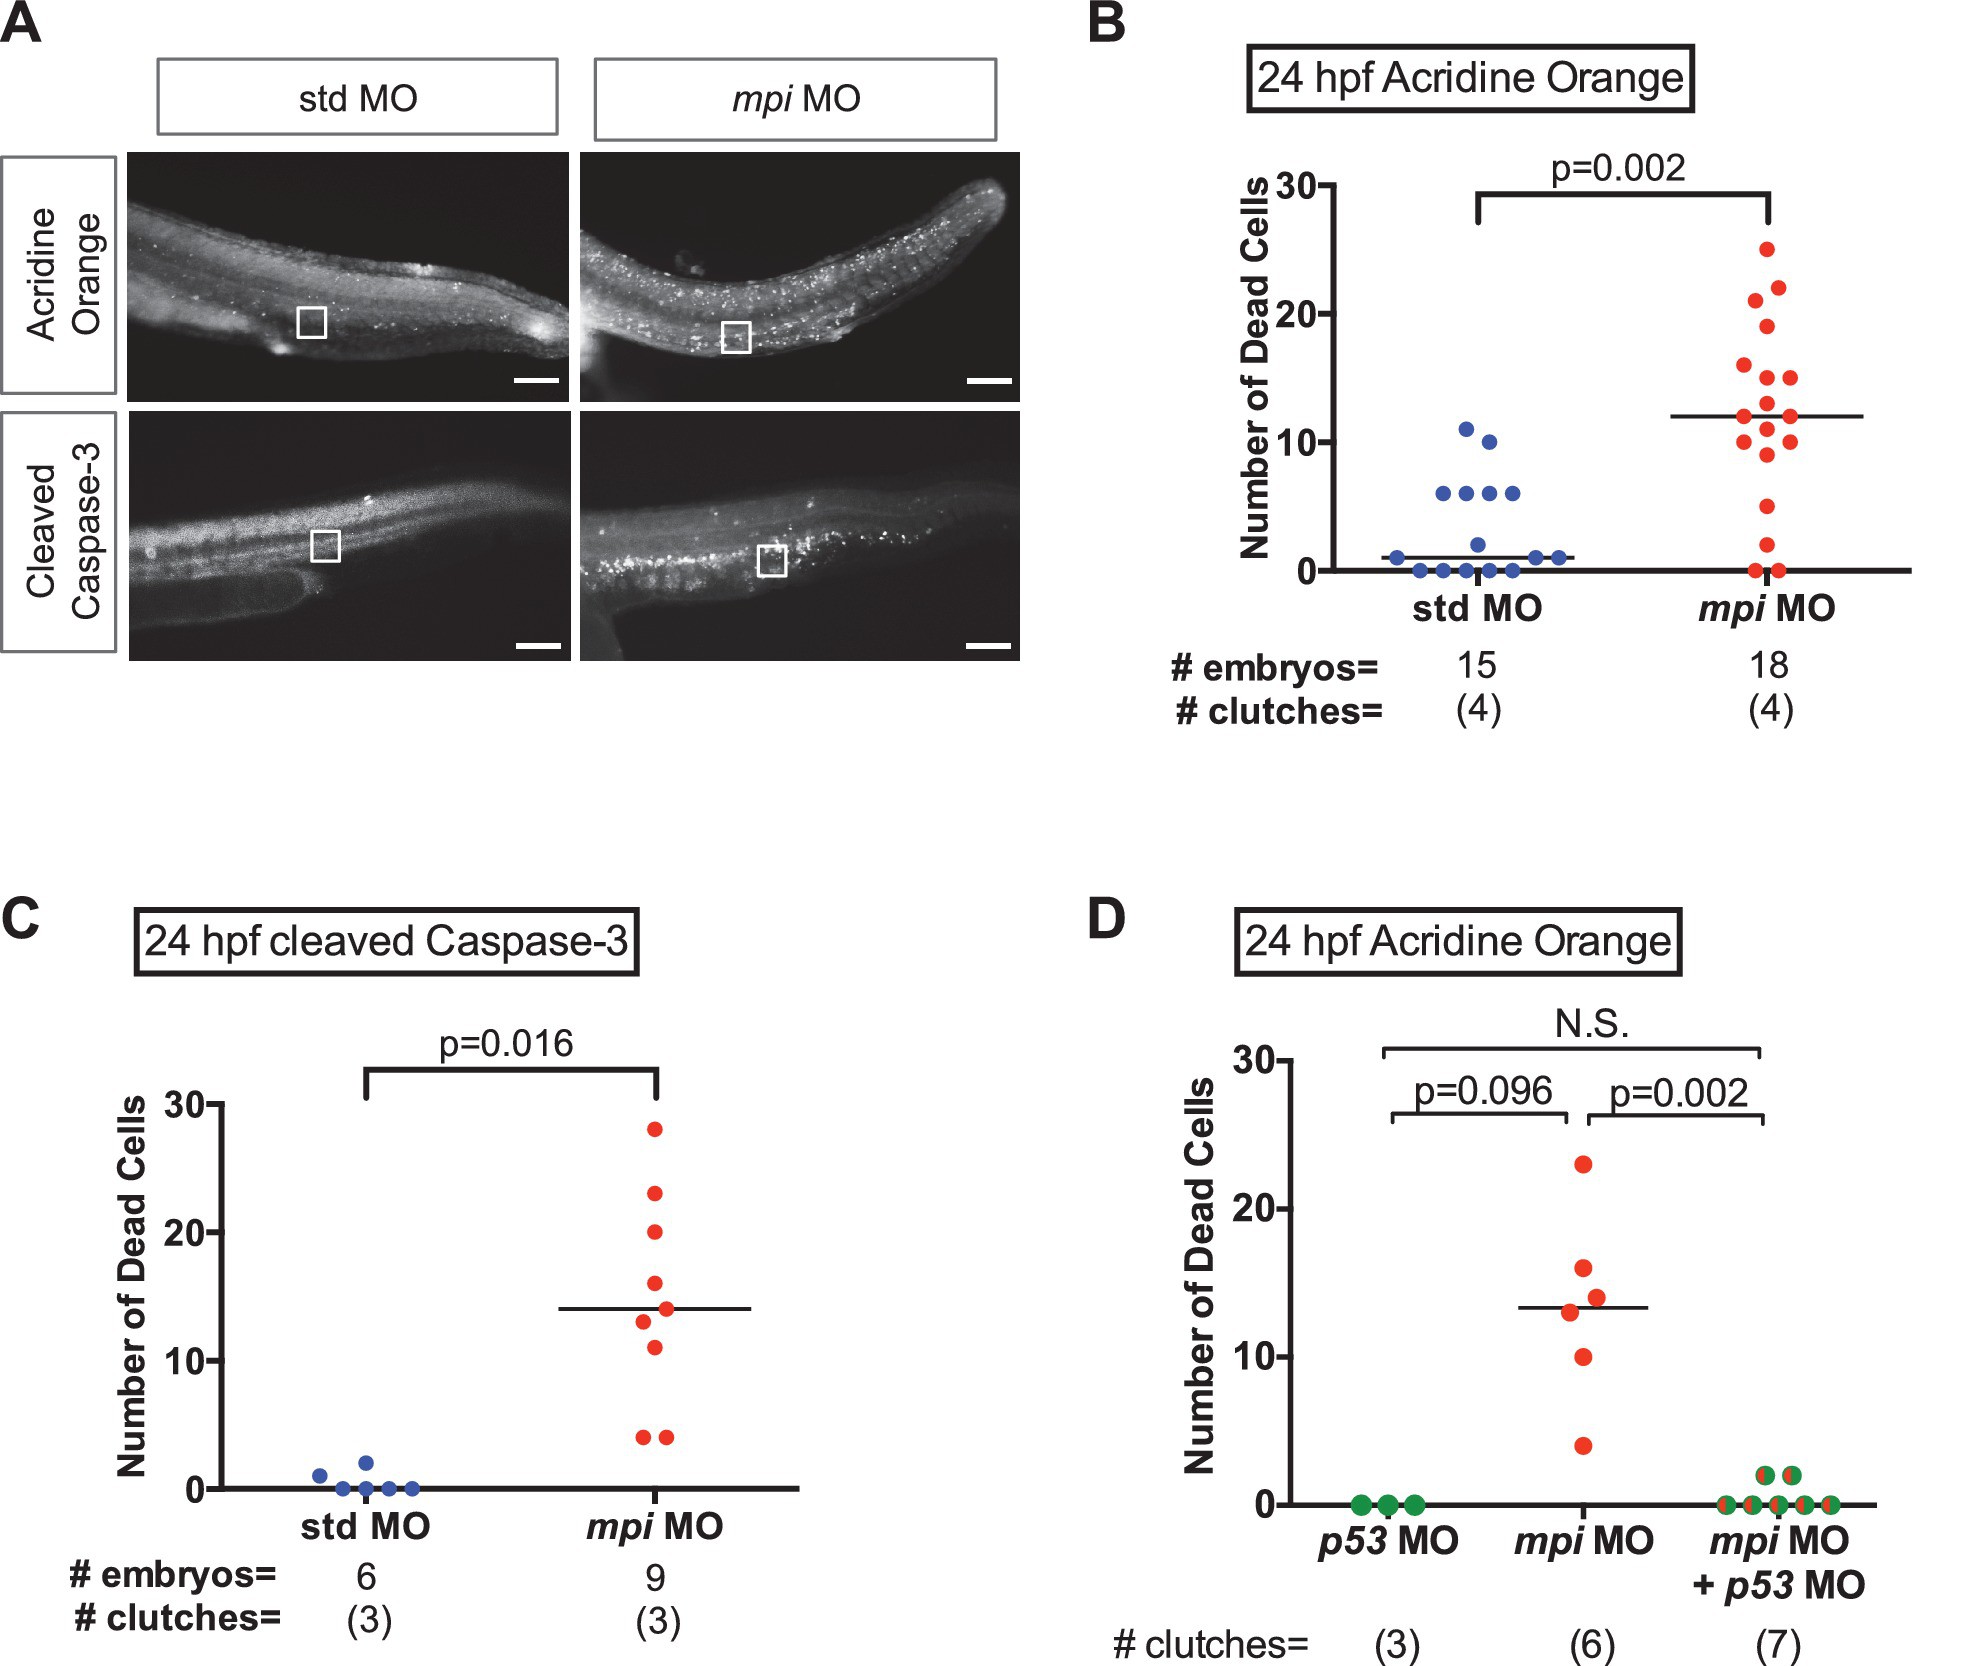
Cell death from loss of Mpi is rescued with p53 depletion.
(A–C) Detection and quantification of apoptotic cell death in 24 hpf embryos injected with std and mpi MO by acridine orange staining observed under GFP (top row), and cleaved Caspase-3 immunofluorescence observed under RFP (bottom row). Scale bar = 100 µM. A standardized area of the tail was used for the quantification. A frame of 75 µm by 75 µm was set and superimposed on the image (white square in image) and positioned from the tip of the anal pore. Using Nikon's NIS-Elements software, cell death was quantified. Dead cells within the standardized area were counted as the total number of dead cells. (D) Quantification of cell death after acridine orange staining of 24 hpf zebrafish embryos co-injected with mpi and p53 MO, compared to each MO alone. The increase in cell death seen in mpi MO was rescued in the co-injected embryos. All p-values based on two-tailed paired Student's t test.