
|
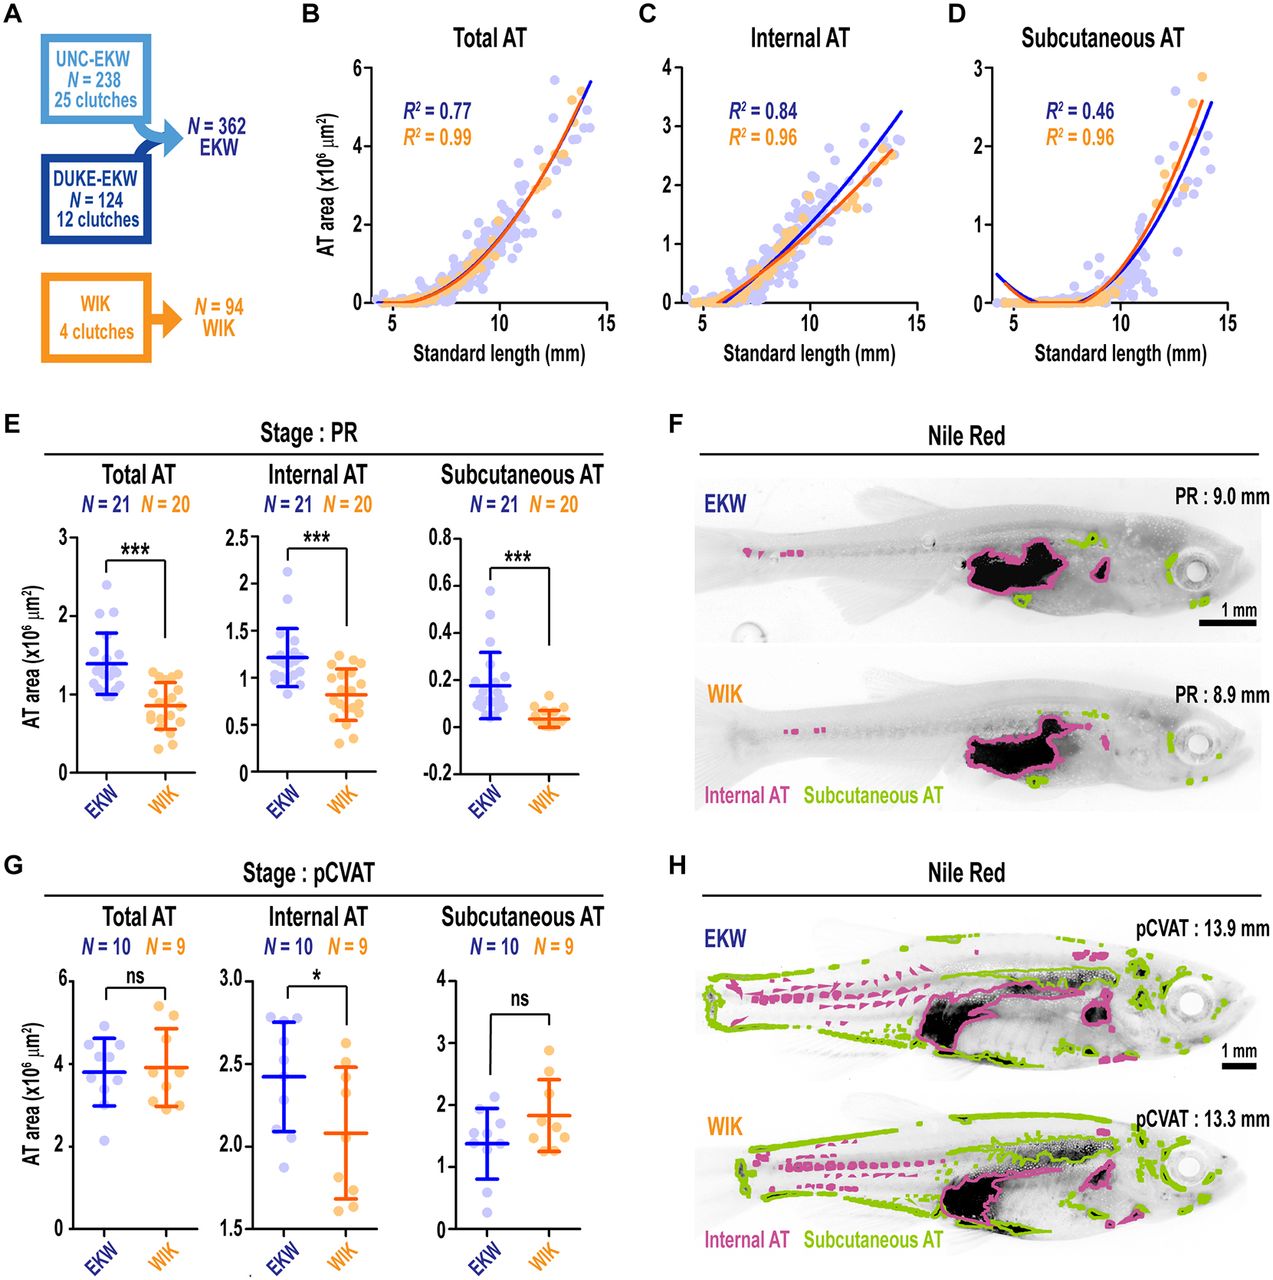
Fig. 5
Comparison of adiposity dynamics between EKW and WIK wild-type zebrafish strains. (A) The 362 EKW zebrafish were compared with 94 WIK zebrafish derived from four independent clutches. (B-D) Scatterplots depicting total AT (B), internal AT (C) and subcutaneous AT (D) area relative to SL. Lines were fitted with polynomial regression. (E) Pairwise comparison of total AT, internal AT and subcutaneous AT between PR stage EKW and WIK zebrafish. (F) Representative images of Nile Red-stained PR stage zebrafish. Images are greyscale, inverted, and ATs are false coloured according to their classification. (G) Pairwise comparison of total AT, internal AT and subcutaneous AT between pCVAT stage EKW and WIK zebrafish. (H) Representative images of Nile Red-stained pCVAT stage zebrafish. Images are greyscale, inverted, and ATs are false coloured according to their classification. Groups were compared using Student's t-tests. *P<0.05; ***P<0.0001.