
|
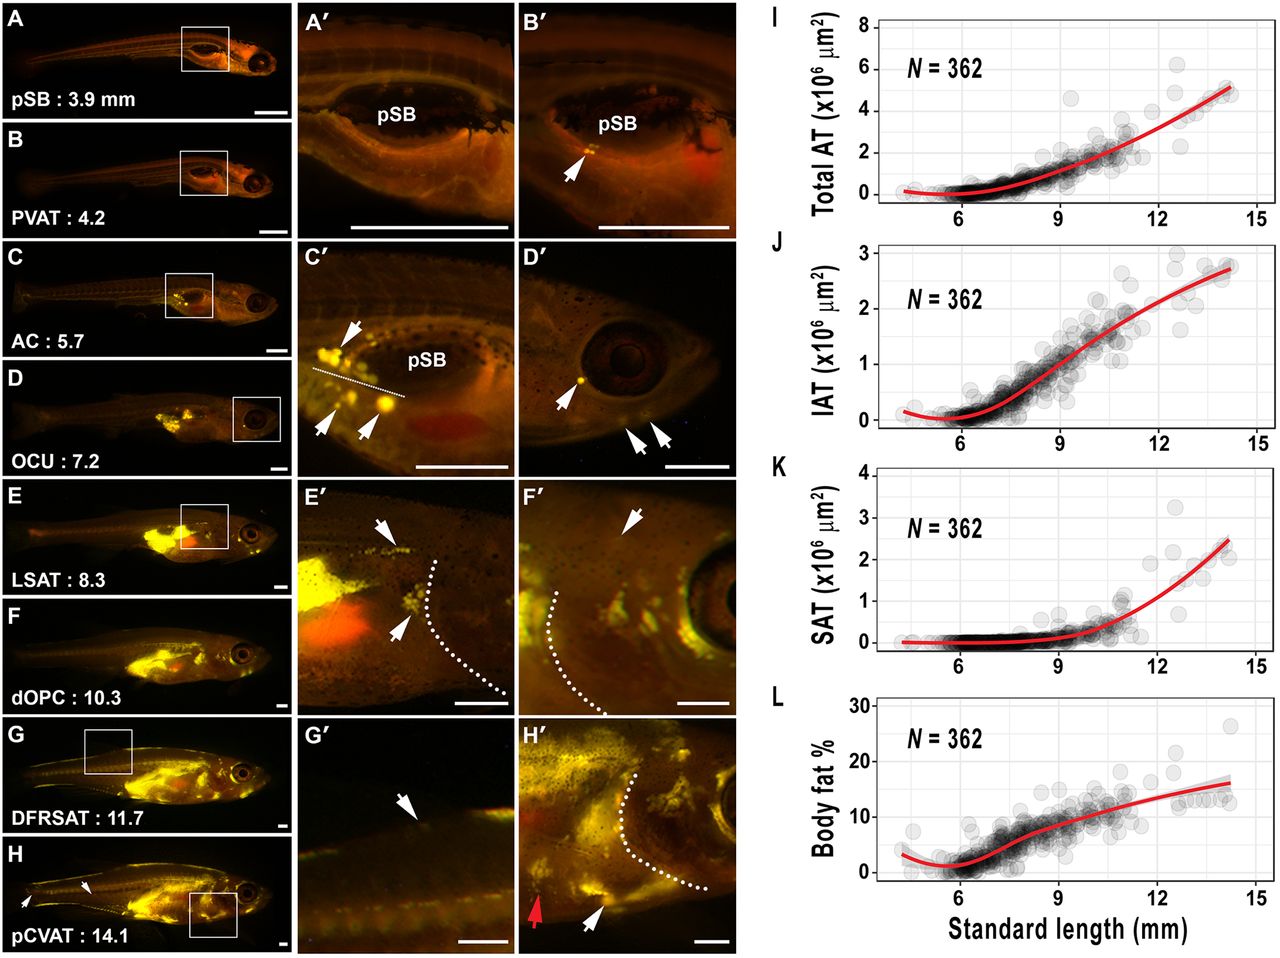
Fig. 4
Adipose tissue growth dynamics in postembryonic zebrafish. (A-H′) Stereoscopic images of Nile Red-stained postembryonic zebrafish at stages indicated in Fig. 3B. The white boxes indicate the location of magnified images in the middle and right panels. The first AT to appear is PVAT (arrow in B′), followed by AVAT (upper arrow in C′; lower arrows beneath the dotted line indicate PVAT). CSAT is formed in the head (arrows indicate OCU or HYD ATs). (E′) LSAT (upper arrow) and RVAT (lower arrow) are detected on the zebrafish flank, and dotted line indicates the edge of the operculum. (F′) dOPC is deposited in dorsal cranial regions (arrow). (G′) DFRSAT is deposited at the dorsal fin (arrow). (H′) pCVAT is deposited on the ventral trunk in close proximity to the heart (white arrow; red arrow indicates lPECSAT). Dotted lines indicate the operculum boundary. (I) Total AT area relative to SL. (J) IAT area relative to SL. (K) SAT area relative to SL. (L) Body fat percentage relative to SL. Lines are fitted using locally weighted regression (LOESS) with 90% confidence regions shaded grey.