
|
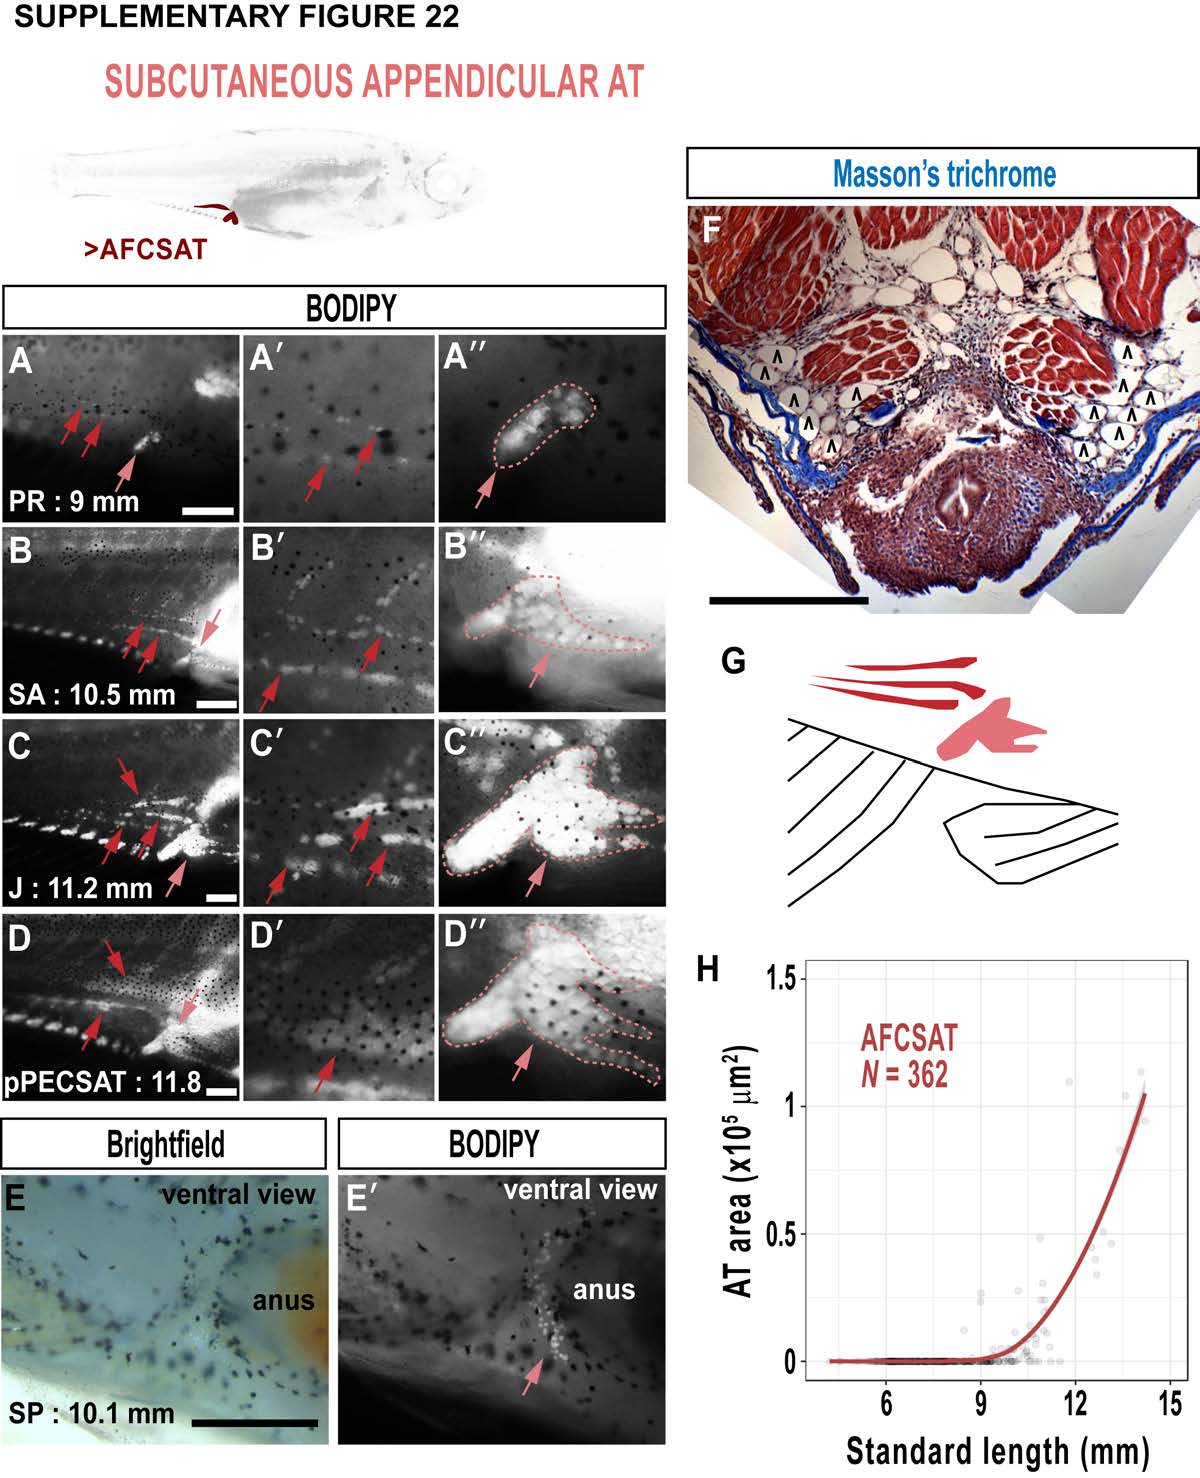
Fig. S22
The complex and distinctive morphology of anal fin cluster SAT (AFCSAT). A-D. BODIPY timeseries illustrating the 2 distinct clusters of AFCSAT; the anterior cluster (light red arrow) and the horizontal stripes (dark red arrows). A'-D'. Magnified images illustrating the horizontal stripes AFCSAT (arrows). A''-D''. Magnified images of the anterior AFCSAT cluster (arrows). E, E'. Brightfield (E) and BODIPY showing the anterior AFCSAT cluster from ventral (arrow). F. Masson's trichrome-stained cross-section showing the bilateral horizontal AFCSAT stripes. G. Schematic illustrating the distinct morphologies of the 2 distinct AFCSAT clusters: the horizontal stripes (dark red) and the anterior cluster (light red). H. Relationship between AFCSAT area and SL. Scale bars are 100 μm (A-E) and 500 μm (F). Fitted lines were generated by a LOESS function.